According to the National Institute of Diabetes and Digestive and Kidney, digestive diseases affect nearly 70 million people every year. And around 48.3 million people access ambulatory care for digestive disease emergency annually.[1] These statistics are reflective of the incessantly increasing and persistent digestive disorders that have plagued human life due to lifestyle changes and highly prevalent unhealthy food. In the earlier days, invasive methods alone existed to diagnose the digestive disease that a person might be suffering from. But with the advent and development of endoscopy, this has transformed and made diagnosis easier for doctors and patients both. Endoscopy devices are therefore in high demand and experiencing a prolific increase in their production and sales. In the year 2018, the endoscopy market earned a noticeable market revenue of $11.4 billion, which has been evaluated to increment at a healthy compound annual growth rate (CAGR) of 6.43% during the forecast period of 2019-2025.
Endoscopy devices have undergone a considerable development in the continent of North America. Telesurgery and virtual reality simulators are some of the newer forms of endoscopy that are being regularly used here. This is the reason why the continent led the endoscopy market geographically with a regional share of 54% in the year 2018. Since hospitals are the most primary end users of endoscopy devices, this application segment has been evaluated to grow with a CAGR of 6.10% through to 2025.
Endoscopy Devices Market Growth Drivers and Trends:
The reason why endoscopy devices market has seen a noticeable rise in the recent past is due to several pros of endoscopy which have made it popular amongst surgeons. Endoscopy is minimally invasive which causes little or no pain to the patients. It is also useful in the treatment of mucosal disorders that occur inside the gastrointestinal tract. Another growth driver that has led to the development of endoscopy devices market is low morbidity and mortality associated with this procedure. Since the development of newer forms of endoscopy such as telesurgey, surgeons can even cure patients while sitting at a completely different site.
With the advancement of technology, endoscopy devices market has also made leaps in its innovation. This market has been disrupted with improvement of image quality obtained from the endoscopes. High definition imaging has been introduced in the endoscopes which helps in obtaining images that are clearer with improved contrast. Consistent system review and improvement in medical staff as well as hiring more professionals for endoscopic activity are other trends that are helping key market players in combating the preexisting disproportionate ratio of demand versus the delivered capacity of the process of endoscopy.
Endoscopy Devices Market Key Players Perspective:
Key market players operating in the endoscopy devices market and holding majority shares include Stryker Corporation, Smith & Nephew PLC, Olympus Corporation, Boston Scientific, KARLSTORZ GMBH, Cook Medical Inc., Pentax Medical, Richard Wolf GMBH, Cogentix Medical and Fuji Film Holdings corporation.
Olympus Corporation’s Indian division has come up with a multitude of endoscopy devices which have become highly popular in the healthcare industry including gastroscopes, colonoscopes, duodenoscopes, enteroscopes, capsule endoscopes, bronchoscopes, laparoscopes, resectoscopes, cystoscopes, ureterorenoscopes, hysteroscopes, and others.
The base year of the study is 2018, with forecast done up to 2025. The study presents a thorough analysis of the competitive landscape, taking into account the market shares of the leading companies. It also provides information on unit shipments. These provide the key market participants with the necessary business intelligence and help them understand the future of the Endoscopy Devices Market. The assessment includes the forecast, an overview of the competitive structure, the market shares of the competitors, as well as the market trends, market demands, market drivers, market challenges, and product analysis. The market drivers and restraints have been assessed to fathom their impact over the forecast period. This report further identifies the key opportunities for growth while also detailing the key challenges and possible threats. The key areas of focus include the types of cheese in the Endoscopy Devices Market, and their specific applications in different areas.
Endoscopy Devices Market Report: Industry Coverage
The endoscopy devices market can be segmented into product, end-user, and application. Based on products, the market can be divided into by type, by documentation system, accessory, mechanical endoscopy equipment, and others. By end user industry, the market can be bifurcated into hospital and clinic. By application, the market can be fragmented into bronchoscopy, arthoscopy, laparoscopy, and others.
The Endoscopy Devices Market report also analyzes the major geographic regions for the market as well as the major countries for the market in these regions. The regions and countries covered in the study include:
• South America: Brazil, Venezuela, Argentina, Ecuador, Peru, Colombia, Costa Rica
• Europe: The U.K., Germany, Italy, France, The Netherlands, Belgium, Spain, Denmark
• APAC: China, Japan, Australia, South Korea, India, Taiwan, Malaysia, Hong Kong
• Middle East and Africa: Israel, South Africa, Saudi Arabia
“We also publish more than 100 reports every month in “Lifesciences and Healthcare”, Go through the Domain if there are any other areas for which you would like to get a market research study.”
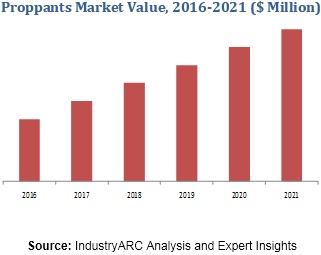
The demand for oil & gas was gauged to be 145.7 mboe/d in 2015, and the Organization of Petroleum Exporting Countries (OPEC) projects that the demand will catapult to 193.9 mboe/d in 2040.[1] This growing demand for oil & gas is poised to drive associated industries, and one of those sectors is the proppants market, which was worth $8.1 billion as of 2018. This is because proppants are used during the fracking stage of oil & gas extraction. Owing to the augmented demand for oil & gas, the proppants market is poised to observe growth at a profitable compound annual growth rate (CAGR) of 7.10% during the forecast period 2019–2025.
According to the US Energy Information Administration (EIA), in 2018, as much as 6.44 million barrels per day of crude oil production in the U.S. was attributed to tight oil resources, which equals to 59% of the total crude oil production in the U.S.[2] North America has been the highest producer of oil & gas for quite a few years, and undisputedly so because of the booming shale gas market in countries such as the US and Canada. Evidently, the oil & gas industry in the region is offering opportunities to the vendors in the proppants market. North America had the highest proppants market share of 71% in 2018.
Proppants Market Outlook:
Proppants or ceramic proppants produced in engineered proppants plants are sand-like materials that are used in the fracking and hydraulic fracturing stage of oil & gas production or extraction. They are used for fracking with various oil & gas resources such as shale gas, tight oil, and coal bed methane.
The most gainful segment of the proppants market is frac sand, which is poised to observe an increment at a staggering CAGR of 54% over the forecast period. This can be attributed to the amplified supply of frac sand, which is easily available and relatively affordable. Even though in-basin sand mines are proving to be a threat to the frac sand market, the mines are not yet operational, and the future will observe an increasing application of frac sand for the fracking process.
Proppants Market Growth Drivers:
· The Overall Growth of Hydraulic Fracturing Services –
According to the US EIA, 95% of the new wells drilled are hydraulically fractured, which substantially supports the hydraulic fracturing market.[3] The growth prospects in the hydraulic fracturing & services market can be further fathomed by the fact that the U.S. and Canada are continuously observing rise in the revenues generated from this market. Evidently, the service providers need proppants that are designed to keep an induced hydraulic fracture open during the process. Furthermore, the exploration and production activities are makings strides, and therefore, there is a discernible demand influx in the hydraulic fracturing market, which is supporting the proppants market.
· The Resin-Coated Proppants Gaining Traction –
The resin-coated proppants are found to be increasing productivity of oil wells. An increase in oil well activities is foreseen in order to meet the demand for oil & gas as mentioned in the sustainable development goals (SDGs) of the United Nations (UN). This will require an enhanced efficiency in activities, and so, the resin-coated proppants will be used more. The vendors in the proppants market will observe an increased application of resin-coated proppants.
· Ceramic Proppants to Observe Demand Influx for High-Pressure Operations –
The deep and high-pressure oil wells in Texas, Los Angeles, Saudi Arabia, and Nigeria typically require heavy-weight ceramics with high alumina or bauxite content. Evidently, ceramic proppants have stronger molecular structure as compared to others. Furthermore, they have a consistent size and spherical shape and offer higher crush strength as compared to others. The exploration activities in the deep, high-temperature, and high-pressure oil wells is poised to drive the ceramic proppants market.
· Incorporation of Ecofriendly Processes in Oil Wells –
The protection of environment has become imperative in all the industries and the oil & gas sector is no different. Ceramic proppants will observe growth because of they are found to be relatively much more ecofriendly in nature.
Proppants Market Challenges –
The major challenge in front of the vendors in the proppants market is the reduction in operating expenses caused by sand and proppant flowing back. This also affects the turnaround time. However, in the future, the oil well operations will observe the use of resin-coated proppants, which will alleviate the problem of proppant flowing back, but the inculcation of this process will shoot up the budget and create a challenging pricing environment in the proppants market. Moreover, there is going to be a dynamism in the demand of oil & gas for a short period of time, which will affect the proppants market over the forecast period.
Proppants Market Key Players Perspective –
The major players striving to capitalize on the demand influx in the proppants market are Badger Mining Corporation, Momentive Performance Materials, Unimin Corporation, U.S. Silica Holdings Inc., Compagnie de Saint-Gobain S.A., Carbo Ceramics, Inc., Fores, Cadre, Borovichi Refractories Plant, Mineracao Curimbaba Ltd., and Hi-Crush LP Partners.
Proppants Market Research Scope:
The base year of the study is 2018, with forecast done up to 2025. The study presents a thorough analysis of the competitive landscape, taking into account the market shares of the leading companies. It also provides information on unit shipments. These provide the key market participants with the necessary business intelligence and help them understand the future of the proppants market. The assessment includes the forecast, an overview of the competitive structure, the market shares of the competitors, as well as the market trends, market demands, market drivers, market challenges, and product analysis. The market drivers and restraints have been assessed to fathom their impact over the forecast period. This report further identifies the key opportunities for growth while also detailing the key challenges and possible threats. The proppants market research report also analyses the application of proppants in shale gas, tight oil, and coal bed methane mining processes in the oil & gas industry.
The proppants market report identified the current trends, opportunities, and challenges in the industry along with a detailed depiction of strategies by the existing market players.
The report also analyzes the proppants market on the basis of type that includes sand, resin-coated, and ceramic proppants with growth prospects in each segment with future projections.
The report also analyzes the major geographic regions as well as the major countries in these regions. The regions and countries covered in the study include:
North America: The U.S., Canada, Mexico
South America: Brazil, Venezuela, Argentina, Ecuador, Peru, Colombia, Costa Rica
Europe: The U.K., Germany, Italy, France, the Netherlands, Belgium, Spain, Denmark
APAC: China, Japan, Australia, South Korea, India, Taiwan, Malaysia, Hong Kong
Middle East and Africa: Israel, South Africa, Saudi Arabia
“We also publish more than 100 reports every month in “Chemicals and Materials”, Go through the Domain if there are any other areas for which you would like to get a market research study.”
According to the Federation of European Specialty Food Ingredients Industry, currently the specialty food ingredients market contribute around $40 billion to the annual turnover of the European Union food and drinks industry.[1] As per the prevalence, these foods are of high quality and are used for production of high-value food products with improved shelf life, production value, good for health, and improved taste. Owing to this, the global specialty food ingredients market size stood at $43 billion in 2018. These ingredients are essential in providing the consumers with a wide range of safe, qualitative, and affordable foods. The demand is anticipated to grow at a CAGR of 6% during the forecast period 2019-2025.
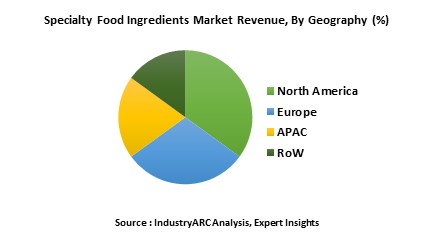
North America, has been observing continuous growth in the region due to growing concerns regarding eating healthier food and magnificent capacity of production in the United States and Canada. The rising concerns of obesity and diabetes are influencing the consumers to focus more on healthy life, owing to this, the demand for healthy food has flourished in the North America specialty food ingredients market. In 2018, North America had the maximum specialty food ingredients market share of 36%.
Specialty Food Ingredients Market Outlook:
Specialty food ingredients emulsifies, preserves, provides color and texture, and improves the nutritional value of the processed or cooked food, owing to these factors, the industry is able to meet the consumers demand. Additionally, strong science-based and strong innovation-driven position in the process of food chain makes the specialty food ingredients market a major contributor of the food and beverage sector.
The growth of specialty food market is considerably dependent on the sustainability of the processed food products. Furthermore, Europe along with North America is investing ample amount of money in the R&D for developing innovating specialty food ingredients. These activities are ballooning the Europe bakery market. Owing to immense use in bakery and confectionary, the specialty food ingredients market is predicted to observe growth at a CAGR of 5.80% through to 2025.
Specialty Food Ingredients Market Growth Drivers and Market Trends:
· Plant-Based Specialty Food Ingredients
2018 was a year for plant-based food in the market. Owing to the emerging preference towards vegan and organic food, and the changing lifestyle of the consumers the plant-based specialty food ingredients are considered as the most nutrient dense foods on earth. Moreover, the growing concerns towards the healthcare is driving the plant-based specialty food ingredients market.
· Ayurvedic Products Thrives in the Market
The specialty food ingredients market is targeting the old age consumers as they are more inclined towards ayurvedic products. The manufacturers are working towards setting up new menu for their consumers and it is driving growth for the market.
There has been a significant growth in the refrigerated RTD functional beverages sales in the recent years. For instance, the probiotic-friendly kombucha has taken over the market, inviting more functional beverages competitors that tout the health.
In March 2019, Ingredion Incorporated, an ingredient provider company, announced its operations acquisition of Western Ploymer, a company that supplies high-quality starch products. The acquisition is to enhance the high-value specialty ingredients business and the processing capabilities.
· Cargill Intends to Acquire Smet
In April 2019, Cargill Incorporated, a conglomerate company, announced its intent to acquire Smet, a Belgium-based supplier chocolate company, for their global gourmet chocolate activities by expanding the product portfolio and services.
The major players striving to capitalize on the specialty food ingredients market are The Archer Daniels Midland Company, E. I. Du Pont de Nemours and Company, Cargill Incorporated, Kerry Group, Ingredion Incorporated, Tate & Lyle, Naturex S.A., Prinova Group LLC, HR Hansen Group, and Koninklijke DSM N.V.
Specialty Food Ingredients Market Research Scope:
The base year of the study is 2018, with forecast done up to 2025. The study presents a thorough analysis of the competitive landscape, taking into account the market shares of the leading companies. It also provides information on unit shipments. These provide the key market participants with the necessary business intelligence and help them understand the future of the specialty food ingredients market. The assessment includes the forecast, an overview of the competitive structure, the market shares of the competitors, as well as the market trends, market demands, market drivers, market challenges, and product analysis. The market drivers and restraints have been assessed to fathom their impact over the forecast period. This report further identifies the key opportunities for growth while also detailing the key challenges and possible threats. The specialty food ingredients market research report also analyses the application of the specialty food ingredients in various applications such as Bakery & Confectionery, Dairy Products, Meat Products, Savory & Salty Snacks, and Beverages.
Specialty Food Ingredients Market Report: Industry Coverage
This report also documents the specialty food ingredients market based on product type that includes Flavors, Acidulant, Colors, Enzymes, Emulsifiers/Stabilizers, Food Preservatives
The specialty food ingredients market report also analyzes the major geographic regions as well as the major countries in these regions. The regions and countries covered in the study include:
South America: Brazil, Venezuela, Argentina, Ecuador, Peru, Colombia, Costa Rica
Europe: The U.K., Germany, Italy, France, the Netherlands, Belgium, Spain, Denmark
APAC: China, Japan, Australia, South Korea, India, Taiwan, Malaysia, Hong Kong
Middle East and Africa: Israel, South Africa, Saudi Arabia
“We also publish more than 100 reports every month in “Food and Beverage”, Go through the Domain if there are any other areas for which you would like to get a market research study.”
Modern day lifestyles have altered our consumption patterns, and the beverage industry is leveraging this trend. Compactness and mobility in terms of packaging of products are the lucrative characteristics being offered by the modern brewing sector to construct additional opportunities of revenue. As per the Kirin Beer University, global beer consumption in 2017 was estimated to be 186.72 million kiloliters. In terms of revenue earned by non-alcoholic beverages, PepsiCo reported an annual revenue of $63.5 billion in the same year. Increasing beverage consumption has generated demand for efficient packaging trends with provisions for longer shelf life, aroma retention, heat insulation, sealing and barrier against moisture. Such demands have driven the glass packaging market size to a staggering $51 billion in 2018. Beverages is an application segment under the glass packaging market, which also sees application across industries including food, pharmaceuticals, and cosmetics with eco-friendly, recyclable and sustainable products. Ban on plastic globally is shifting packaging demand towards glass, with demand growing at a global CAGR of 4.7% during the forecast period of 2019-2025.
The APAC region is estimated to be the leading region with 37% share of the global glass packaging market in 2018. Further analysis of imports and exports of glass products and consumption of beverages indicates several factors in support of APAC’s dominance in the global glass packaging market.
· India is the leading importer of limestone, a chief raw material employed in manufacturing glass bottles.
· In 2017, China lead globally in terms of exports of glass bottles and containers for packaging and conveyance goods with export values amounting to $1.7 billion and $1.67 billion respectively.
· Asia retained its monopoly in beer consumption for the tenth consecutive year in 2017, and garnered 33.7% share in the global beer market.
· According to the India Brand Equity Foundation (IBEF), India is estimated to be among Coca-Cola’s top three markets in terms of volumes, by 2021. It occupied the sixth spot in 2018 and is targeted to be fifth by the end of 2019.
With the beverages industry being the dominant employer of glass packaging, alcoholic beverages is identified to be the fastest growing application segment, progressing at a CAGR of 6.9% going through 2025. With alcohol consumption escalating year on year and novel entrants such as craft beerdisrupting the market, alcoholic beverages will sustain their dominance in the glass packaging market share.
Glass Packaging Market Growth Drivers:
Glass to Substitute the Enormous Plastic Empire-
Implementation of stringent bans on the use of plastic by countries worldwide is a major factor diverting substantial traffic from plastic packaging towards the eco-friendly and recyclable glass packaging market. As per the Plastic Oceans Organization, more than eight million tons of plastic are dumped into the oceans every year and owing to such alarming circumstances, the U.N. launched the #CleanSeas campaign to eliminate marine litter by 2022. With plastics being eradicated due to ecological concerns, glass packaging remains the primary option due to its recyclable properties. Furthermore, glass is resistant and non-porous; thus it cannot contaminate the product packed inside it. This is increasing its application in the cosmetic packaging market and pharmaceutical packaging market.
· Organic product vendors are shifting from plastic packaging to glass packaging since the entire unique selling point (USP) of organics can be overshadowed by application of environmentally hazardous plastics for packaging. For instance, organic dairy producers are witnessing demand from organically-inclined customers for glass bottles that can be reused, refilled and recycled. Similarly, in the cosmetics industry, the trend of organic products is leading to increased demand for glass packaging.
· Coca Cola recently announced a ‘World Without Waste’ campaign and accepted accountability for increase in the amount of plastic litter globally. The company which markets about 500 brands of beverages, is anticipated to switch to glass and cans or cardboards by 2020. This trend is being followed by several vendors and even enforced by governments globally. The glass packaging market is bound to flourish since its products are an eco-friendly and recyclable option.
Glass Packaging Market Companies:
Some key players operating in the global glass packaging market are Saint-Gobain S.A, Owens-Illinois, Bormioli Rocco SPA, Schott AG, Heinz Glass, Ardagh Group SA, Vidrala, Gerresheimer AG, Vetropack Group, Orora Packaging Australia Pty Ltd, Hindusthan National Glass & Industries Limited, and Amcor Limited.
Glass Packaging Market Research Scope:
The base year of the study is 2018, with forecast done up to 2025. The study presents a thorough analysis of the competitive landscape, taking into account the market shares of the leading companies. It also provides information on unit shipments. These provide the key market participants with the necessary business intelligence and help them understand the future of the Glass Packaging Market. The assessment includes the forecast, an overview of the competitive structure, the market shares of the competitors, as well as the market trends, market demands, market drivers, market challenges, and product analysis. The market drivers and restraints have been assessed to fathom their impact over the forecast period. This report further identifies the key opportunities for growth while also detailing the key challenges and possible threats. The key areas of focus include the various types of trends in global Glass Packaging Market, and their specific advantages to the market.
The Glass Packaging Market report also analyzes the major geographic regions for the market as well as the major countries for the market in these regions. The regions and countries covered in the study include:
• South America: Brazil, Venezuela, Argentina, Ecuador, Peru, Colombia, Costa Rica
• Europe: The U.K., Germany, Italy, France, The Netherlands, Belgium, Spain, Denmark
• APAC: China, Japan, Australia, South Korea, India, Taiwan, Malaysia, Hong Kong
• Middle East and Africa: Israel, South Africa, Saudi Arabia
“We also publish more than 100 reports every month in “Chemicals and Materials”, Go through the Domain if there are any other areas for which you would like to get a market research study.”
According to the Consumers International Organization, globally, with the advent of the Internet of Things (IoT) nearly four billion people will join the network of the connected devices by 2020. IoT transformation has changed the energy-driven consumer electronic devices, thereby encouraging the use of efficient energy harvesting systems throughout the world. The global energy harvesting market was valued at 278.19m in 2018, after gaining traction through wide application in various electronic equipment such as wearable, smartphones, wireless sensor networks (WSNs), and many others. There is a huge gap between the energy required to operate these devices and the energy available in the global scenario. This implicates the necessity for harvesting energy to bridge the gap, consequently pushing forth the global energy harvesting system market growth. The energy harvesting systems market is projected to grow at a robust CAGR of 18.48% through to 2025.
Multifarious industries such as medical, consumer electronics, automation, and other industries depend largely on the ambient power systems in recent times. Concurrently with the emergence of sustainable energy harvesting systems, there is a significant replacement of battery and high energy-consuming products across the world. The demand generated by the home and building automation segment is anticipated to increase considerably at a CAGR of 16.14% during the forecast period of 2019-2025. Europe is the main region successfully marching towards clean technology usage for executing various industrial purposes. Europe is also significant for technological advancements such as cultivating the provision for better implantable medical electronics, pollution monitoring sensors, preference for green buildings, and many others. Furthermore, companies such as EnOcean, Pavegen and Micropelt are promoting the energy harvesting solutions for various end-users which will subsequently generate healthy revenue income in this region. Consequently, Europe which contributed a major regional share of 36.4% to the global energy harvesting market and is anticipated to accomplish prominent development in this sector in the future years.
Energy Harvesting Market Growth Drivers:
· Growing IoT trend will effectively increase the need for wireless sensors and energy efficient autonomous systems in the global market. As a result, this will stimulate the need for efficient energy harvesting systems which will reduce the need for battery charging thereby minimizing the overall cost. Consequently, IoT intervention in the several industrial and non-industrial purposes will elevate the energy harvesting market demand.
· Rising demand for energy-efficient products, increasing preference for harvesting renewable energy, construction of automated buildings and homes, and mounting growth of electronic devices such as smartwatches and smartphones considerably generate demand for power-efficient technologies which influences the energy harvesting market growth.
Energy Harvesting Market Companies:
The leading energy harvesting companies in the global market includes Cymbet Corporation, ABB Ltd, Powercast Corporation, Honeywell International Inc., Microchip Technology Inc., General Electric, Texas Instruments Inc., EnOcean GmbH, and others.
EnOcean GmbH is a Germany-based company credited for delivering energy harvesting wireless technology for building automation, smart home, machine to machine applications, and various others.
Energy Harvesting Market Trends and Innovations:
· Smart Wearable Without Battery Backup:
Innovation is fueling the trend of market competition across the world. Recently, NOWI introduced a new innovative technology which enables IoT devices such as smartwatches to power through the energy available in the surrounding which includes radio waves, light, heat, and physical movement. It is claimed to can easily function with an extended longtime service and also doesn’t require any battery installation. This breakthrough development will eventually revolutionize the face of IoT products thereby upheaving the energy harvesting market growth.
· Energy Harvesting Driven Pacemakers:
Pacemakers are vital devices for saving many lives whence it also poses the risk of interaction of harmful battery components with the human body. A research conducted by the University of Connecticut and UCLA offered a solution to this problem by developing a superconductor based energy harvesting method for modern pacemakers. Moreover, this revolutionary superconductor gets charged through the heat and movement of bodily fluids. Significantly, this technology will boost the development in the energy harvesting sector whereby leveraging huge demand and growth.
The base year of the study is 2018, with forecast done up to 2025. The study presents a thorough analysis of the competitive landscape, taking into account the market shares of the leading companies. It also provides information on unit shipments. These provide the key market participants with the necessary business intelligence and help them understand the future of the Energy Harvesting market. The assessment includes the forecast, an overview of the competitive structure, the market shares of the competitors, as well as the market trends, market demands, market drivers, market challenges, and product analysis. The market drivers and restraints have been assessed to fathom their impact over the forecast period. This report further identifies the key opportunities for growth while also detailing the key challenges and possible threats. The key areas of focus include the types of Energy Harvesting in the Energy Harvesting market and their specific applications in different areas.
Energy Harvesting Market: Industry Coverage:
The global energy harvesting market can be segmented on the basis of technology, application, and end-user. Technology classification includes thermoelectric energy harvesting, photoelectric energy harvesting, and others. Based on application, bifurcation includes wireless switching, wireless HVAC sensors, and others. By end-users, this market can be divided into home and building automation, consumer electronics, and others.
The Energy Harvesting market also analyzes the major geographic regions for the market as well as the major countries for the market in these regions. The regions and countries covered in the study includes:
• South America: Brazil, Venezuela, Argentina, Ecuador, Peru, Colombia, Costa Rica
• Europe: The U.K., Germany, Italy, France, The Netherlands, Belgium, Spain, Denmark
• APAC: China, Japan, Australia, South Korea, India, Taiwan, Malaysia, Hong Kong
• Middle East and Africa: Israel, South Africa, Saudi Arabia
“We also publish more than 100 reports every month in “Electronics”, Go through the Domain if there are any other areas for which you would like to get a market research study.”
EMEA personal care and cleaning chemicals market is forecast to reach $25 billion by 2024, after growing at a CAGR of 5% during 2019-2024. The growth of EMEA personal care and cleaning chemicals market is mainly driven the increasing initiatives by industry players to enhance the existing products through Research and Development (R&D). Apart from that, the growing demand for halal products, climate conditions, and growing population in Middle and Africa are also playing a pivotal role in supporting the growth of EMEA personal care and cleaning chemicals market.
The report: “EMEA Personal Care and Cleaning Chemicals Market – Forecast (2019-2024)”, by IndustryARC, covers an in-depth analysis of the following segments of the EMEA Personal Care and Cleaning Chemicals Market.
Key Takeaways
· Europe dominates the EMEA personal care and cleaning chemicals market. European cosmetics, especially the branded products with the designer labels, are considered as high-end products in the global market. The German personal care and cleaning chemicals market accounted for the highest revenue share in 2017.
· The increasing demand for personal care chemicals, supported by the rising consumer awareness towards ingredients and the rising middle class with higher disposable income, is fueling the demand for surfactants.
· The demand for cleaning products is mainly driven by the more demanding lifestyles of people that require cleaning products, which are efficient and requires less time to clean things.
Type – Segment Analysis
Surfactants hold the largest market share of the EMEA personal care and cleaning chemicals market in 2018, followed by esters segment; while mild surfactants are expected to witness the highest growth rate during the forecast period. The growing demand for personal care products, supported by increasing household disposable income, has played a significant role in increasing the demand for surfactants. The personal care industry use amphoteric surfactants owing to its mild and skin-friendly features. Further, in 2017, the Organization for Economic Co-operation and Development (OECD) reported a 3.5% year on year (y-o-y) growth in the European Union’s household disposable income.
Application- Segment Analysis
Cleaning segment held the largest share in EMEA personal care and cleaning chemicals market in 2018, followed by personal care segment; while the personal care segment is expected to witness the highest growth rate during the forecast period. The personal care industry will remain the most attractive market for Europe chemical manufacturers in the forecast period.
Consumers are getting more aware of the organic and natural care products, around 80% the demand from Spain is driven by natural products, which were not tested on animals. The growing consumer demand for organic and natural care products has actuated many industry players to change their planning their production and R&D activities per their customer’s viewpoint.
Europe dominated the EMEA personal care and cleaning chemicals market with a share of 80%, followed by the Middle East and Africa. The growth of personal care and cleaning chemicals market in the European market is mainly driven by growing domestic demand for personal care and cleaning products. In the last few years, Germany has emerged as a major market for cosmetics; while the UK held in the largest share in European sun care products.
In European cleanings products market, household cleaning chemicals held the largest share while Industrial & Institutional segment holds the remaining share. The demand for household cleaning chemicals is mostly driven by the growing utilization of laundry detergents in household laundry activities. The increasing adoption of automated washing machine has boosted the demand for laundry detergent in millions of households around Europe.
Owing to its large consumer base and steady beauty care market, Germany continues to dominate the European personal care and cleaning chemicals market. In 2017, Germany had around 82 million consumers that played a key role in supporting the growth of personal care and cleaning chemicals market. Further, in 2017, the German Cosmetic, Toiletry, Perfumery, and Detergent Association (IKW) reported a 0.5 % y-o-y growth for the beauty care market.
Drivers – EMEA Personal Care and Cleaning Chemicals
· Product enhancement through R&D and focus on consumer safety in Europe cosmetic industry
The growing R&D investment mainly drives the cosmetics and personal care industry for product development and enhancement. In 2018, Cosmetic Europe reported that Europe has at least 77 innovation facilities that research cosmetics. Scientists in Europe are developing cosmetic products by reformulations and the adoption of modern procedures. European Scientists are using materials at a molecular level to develop whole new generation products, not only for cosmetic products such as sun creams but also medicines, electronics, and telecoms.
The European Union Cosmetics Regulation is another factor driving the market as it regulates the safety of cosmetics for consumers through rigorous science-based regulations. The European consumers are concerned about the quality, safety, and organic content in personal care products which has made the European Union Cosmetics Regulation body to draft the safety rules under Regulation (EC) No. 1223/2009 to fulfill the need and demand of consumer preference.
· Demand for Halal products, climate conditions, and growing population in MEA region
The cosmetics industry in the Middle East and some part of the African region are focusing on producing Halal personal care products which meet the criteria according to the Islamic faith. The increase in population has escalated the demand for personal care products across the MEA region. With the growing population, more youngsters, including men and women’s are taking up personal care as their daily requirement, need to look better or beautiful.
The Halal products comply with the Islamic faith and reassure Muslim consumers that the products they use are natural, pure, and hygienically manufactured, and animal-cruelty free. The rise of halal category comes hand in hand with the rising segment of the young population keen to combine religious observance with an emphasis on fashion and beauty in the Middle East. Women who wear hijab often need targeted scalp care and hair products, and for men, beard oils and skin balm are popular.
The middle-class population in Africa has a triple fold in the last few decades, and modernization of many African countries has attracted the attention of big cosmetics groups to invest in personal care and cosmetic products.
Challenges – EMEA Personal Care and Cleaning Chemicals
· Regulatory challenges from government regulation body
Various regulations related to the usage of certain chemicals in personal care and cleaning products has emerged as a significant challenges beauty industry in Europe, Middle East, and Africa. In Europe, the beauty industry is facing challenges with regulations related to harmonizing the interpretation of the procedure of banning Carcinogenic, mutagenic, reprotoxic (CMR) substances. The EU Cosmetics Regulation 1223/2009 contains provisions on the use of CMR in cosmetic products.
The regulatory standard gives assurance to the consumers that a product is safe and of good quality. In Africa, countries such as South Africa is generally a self-regulated, and firms are still required to comply with certain standards such as Good Manufacturing Practice (GMP), which is costly. Currently, South African Bureau of Standards (SABS) does not offer this service and firms can only opt to private testing making it relatively expensive, but these regulations are not necessarily prohibitive for smaller players looking to access the mass market which in thus raises the concern among consumers for homemade products.
The members of the Gulf Cooperation Council have sophisticated chemical control regulations throughout the Middle East. They have a strict policy towards the consumer goods in chemical and personal care industry following the international market standards which sets a regulatory barrier for local manufacturers to penetrate or come in the market without having accreditation from well known regulatory bodies cited according to international standards.
· Economic stress and geopolitical tension in the MEA region
The growth in the region can be achieved directly when the region is stable from inside in terms of economic growth and per capita income. The personal care and cleaning chemicals industry’s sales growth rates in the Middle East and some part of Africa has been slow in few years as the region grapples with, international trade regulations and rising geopolitical tensions.
All these factors are directly affecting the buyers buying power as it is crippling the economy, which is affecting the per capita income of the region. Further, it is directly affecting the FDI in the country’s small macro industries for producing commodities according to international standards. A plunge in the Egyptian currency was seen, and Saudi Arabia has reduced dependency on government subsidies, hitting consumer spending.
The unbalance in some parts of African countries such as Zambia has seen a decrease in sustainable economic growth and employment creation, which has affected the spending capabilities of consumers.
South Africa has experienced a premature decline in employment rate and production of the commodity. According to Trade and Industrial Policy Strategies Forum 2017, trade data shows that there is a trade deficit of $536 million for cosmetics and $667 million for soaps and detergents in South African Development Community (SADC) region.
Market Landscape
Product launches, merger & acquisitions, and R&D activities are key strategies adopted by players in the EMEA personal care and cleaning chemicals. In 2018, the market of EMEA personal care and cleaning chemicals had been consolidated by the top five players accounting for xx% of the share. Major players in the EMEA personal care and cleaning chemicals are BASF SE, DowDuPont Inc., Solvay SA, Evonik Industries, AkzoNobel N.V., Symrise AG, Lanxess AG, and Ashland Global Holdings Inc. among others.
Product Launches/ Merger and Acquisition/Product Development
Ø In March 2017, Evonik acquired cosmetics specialist Dr. Straetmans GmbH of Hamburg, Germany. Dr. Straetmans GmbH specializes in developing and marketing alternative preservatives for the cosmetic industry. The move allows Evonik to complement the broad specialties portfolio of its cosmetics business and to further consolidate its position as a leading global partner for the cosmetics industry.
Ø In April 2017, Ashland launched personal care products that are designed to add significant value to industry-leading hair, face and body products. FiberHance bm builds core hair strength without compromising color; Antaron helps sunscreen formulations deliver SPF 50+ UV (ultraviolet) protection without greasiness; and Harmoniance, one of Ashland’s biofunctional products, helps users care for aging skin in multiple ways.
Ø In February 2018, Symrise developed the sensory ingredient for use in creams, gels, and balms and it is readily available to cosmetic formulators.
Ø In July 2018, Symrise launched a SymControl Care active ingredient product that regulates the skin’s sebum production and strengthens the skin barrier
“We also publish more than 100 reports every month in “Chemicals and Materials”, Go through the Domain if there are any other areas for which you would like to get a market research study.”
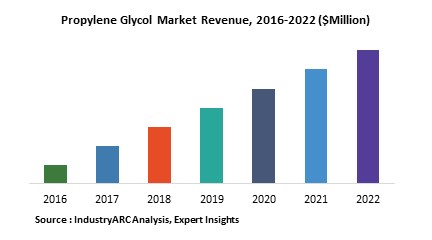
Global Propylene Glycol Market Overview: Propylene glycol, also identified as propane 1, 2-diol according to International Union of Pure and Applied Chemistry nomenclature, is a synthetic organic compound. It is produced from petroleum products as well as it is bio-based and equipped with certain peculiar traits such as outstanding stability, high flash and boiling point, as well as low vapor pressure and broad solvency. Owing to such characteristics it has found tremendous scope of industrial application to craft products such as unsaturated polyester resin, coolants and antifreeze, hydraulic and brake fluid, aircraft deicing fluid, and paints and coatings. The analyst in this research report has stated the global propylene market size to be valued at around $3655 million as of 2018 and is estimated to be growing at a CAGR of around3.9% during the forecast period of 2019-2025. Request Sample Global Propylene Glycol Market Outlook: Propylene Glycol is segmented into two grades mainly industrial and pharmaceuticals. Owing to such deliverance of variants it catches wide applications in countless end-use industries with construction and infrastructure, automotive, aerospace, chemical, household, packaging, food & beverages, pharmaceutical, cosmetics and personal care being the major arcades effecting the global propylene glycol market demand. After an acute analysis of the regional market outlook, APAC region is reckoned to be dominating the global propylene glycol market size by encapsulating more than 32% of the global demand under its own territory. Such dominance can be attributed to the epidemic growth of the Indian and Chinese automotive, construction, F&B, and pharmaceutical sectors catering to nearly half of the global population hosted by these two economies. As per the Open Government Data Platform India latest data records, the total vehicle population in India 2015 was 210 million and the sector is rapidly expanding (5.83%, 2017, OICA), thus the automotive sector being a major employer of propylene glycol as coolants and antifreeze and hydraulic and brake fluid is all set to stroke the market with abundant demand[1]. Global construction market is forecast to grow by $8 trillion by 2030 driven by China, US and India[2]. Unsaturated polyester resins derived from propylene glycol are reinforced with fiber glass to form fiber glass reinforced plastics (FRPs), which has found tremendous employment in crafting building panels, bathroom components, fixtures and corrosion-resistant tanks, pipes, electrical components, paints and ducts in the building and construction sector. Due such extensive scope of application, building and construction sector is leading the application segment and is forecast to grow at a CAGR of around 3.9% going through 2025. Global Propylene Glycol Market Growth Drivers and Trends:
Deicing and anti-icing fluids performs a vital operation in providing safe, uninterrupted and timely air travel during extreme winter conditions. Federal Aviation Administration “Clean Aircraft Concept,” outlaws takeoff with ice contamination on critical surfaces of an airplane. Thus the replacement of ethylene glycol by propylene glycol as the base fluid for aircraft deicing formulations is driving the market towards abundant opportunities of application. Furthermore, cumulative amount of space exploration agendas amalgamated with the ultimatum for high quality antifreeze & coolant is estimated to raise the demand for bio based propylene glycol
According to a 2017 report by Forbes, the top 25 companies in the F&B sector generated $741.2 billion in revenue in 2016 and $86 billion in profit[3]. Another considerable data from Committee for Economic Development states that the food sector accounts for about 5 percent of US GDP and 10 percent of US consumers disposable personal income (DPI)[4]. Now owing to the trend of convenience packaged food for longer shelf life, the employment of propylene glycol as food additives is driving the market and is all set to divert a hefty revenue from the flourishing F&B sector into its own returns pocket.
Global Propylene Glycol Market Challenges: Health problems concerning to propylene glycol is the major challenge encountered by propylene glycol manufacturers. There are several health distresses accompanying propylene glycol that can adversely affect the market growth. However, FDA classifies propylene glycol as an additive that is generally recognized as safe for use in food. Similarly, WHO has specified that the acceptable daily intake of propylene glycol as a food additive should exceed more than 25 mg/ Kilogram of weight.
Inquiry Before Buying Global Propylene Glycol Market Players Perspective: Some of the key players profiled in this business intelligence report are The Dow Chemical Company, LyondellBasell Industries N.V., BASF SE, Archer Daniels Midland Company, Global Bio-chem Technology Group Co., Ltd., DuPont Tate & Lyle Bio Products Company, LLC, Huntsman Corporation and SKC Co., Ltd. The Dow Chemical Company is a significant producer of propylene glycols since 1948. It offers industrial PG grades for industrial applications and specialty PG grades for the employment in subtle and sensitive applications such as pharmaceuticals, F&B, personal care or animal fodder. This flexibility combined with quality control in manufacture, an extensive delivery network and committed client service make propylene glycols from Dow broadly acknowledged and favored by industries.
Global Propylene Glycol Market Research Scope:The base year of the study is 2018, with forecast done up to 2025. The study presents a thorough analysis of the competitive landscape, taking into account the market shares of the leading companies. It also provides information on unit shipments. These provide the key market participants with the necessary business intelligence and help them understand the future of the Global Propylene Glycol Market. The assessment includes the forecast, an overview of the competitive structure, the market shares of the competitors, as well as the market trends, market demands, market drivers, market challenges, and product analysis. The market drivers and restraints have been assessed to fathom their impact over the forecast period. This report further identifies the key opportunities for growth while also detailing the key challenges and possible threats. The key areas of focus include the types of grades in the Global Propylene Glycol Market, and their specific applications in different phases of operations. Buy Now Global Propylene Glycol Market Report: Industry Coverage By Source: Bio based and Petroleum based By End User: Transportation, Building and Construction, and Others By Application: Unsaturated Polyester Resins, Food, Pharma, Cosmetics and Others The Global Propylene Glycol Market report also analyzes the major geographic regions for the market as well as the major countries for the market in these regions. The regions and countries covered in the study include:
North America: The U.S., Canada, Mexico
South America: Brazil, Venezuela, Argentina, Ecuador, Peru, Colombia, Costa Rica
Europe: The U.K., Germany, Italy, France, The Netherlands, Belgium, Spain, Denmark
APAC: China, Japan, Australia, South Korea, India, Taiwan, Malaysia, Hong Kong
Middle East and Africa: Israel, South Africa, Saudi Arabia
“We also publish more than 100 reports every month in “Chemicals and Materials”, Go through the Domain if there are any other areas for which you would like to get a market research study.”
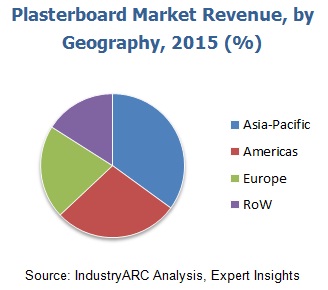
According to Eurogypsum, more than 1,600 million square meters of interior surfaces are covered with plasterboards with around 5 million tons of plaster used for interior lining in Europe each year [1]. Similarly, owing to the on-going construction and intermittent replacement of the old plasterboards with the new ones across the globe, the plasterboard market has attained a permanent demand influx from various sectors, and its market size was $19,754 million in 2018, according to the findings by IndustryARC’s market analyst. Furthermore, the analyst estimates the demand for plasterboard to grow with a modest CAGR of 4.6% during the forecast period of 2019 to 2025. Request Sample According to the United Nations ESCAP (UNESCAP), in 2013, 60% of the world’s population was attributed to APAC which translates to a whopping 4.3 billion. Even though the organization estimates that the population will observe a growth rate of 0.96% year on year, the population will shoot up to around 5 billion in 2050[2] . Now, this gradual population growth is stirring the construction industry, which is creating a major plasterboard marketplace in the APAC region which held the maximum global market share of more than 36% in 2018, according to the market expert.
Plasterboard Market Outlook:
Plasterboard, also known as drywall, wallboard, sheet rock, gyprock, gypsum board, and gypsum panel is a panel made of calcium sulfate dehydrate (dehydrate). It is widely used in walls and ceiling in various sectors such as residential and commercial. Its leading application segment is in the walls. The partitions and linings of the walls contain plasterboard because it also has soundproofing characteristic. “The growing construction in the residential and commercial sector coupled with the on-going trend in which consumers from both the sectors have a palpable predilection for the soundproof walls will collective make the plasterboard market boom in the future,” highlights the market analyst in the plasterboard market research report. Furthermore, the analyst estimates the progression in the application CAGR of plasterboard in the walls segment to be 4.9% through to 2025.
Plasterboard Market Growth Drivers:
The Construction Industry Growth –
As mentioned earlier, the plasterboard market is predominantly making strides because of the growing construction industry. The construction industry is further segmented into commercial and residential –
The Population Growth Supporting the Real Estate Business –
By now, it’s discernible that there is a tangible upsurge in the world’s population, and it is only going to grow. This is bringing a seismic shift in the real estate sectors with the latest trend of smart homes which significantly make use of plasterboard.
Economic Growth and the Emergence of New Commercial Buildings –
The world is at the helm of economic progress, and most of the businesses now rely on technology which is leading to new projects in commercial buildings and complexes. Now, these buildings are incorporated with the plasterboard walls, which is further flourishing the plasterboard market. Inquiry Before Buying
Dry Construction Technique Gaining Prominence –
Dry Construction Technique (DCT) is 8-10 times lighter than the conventional brick construction technique and also enables 70% savings of the time which also helps the builders in to meet the targets in the turnaround time. Moreover, it reduces the use of water, thereby minimizing the impact of real estate on the environment. Now, this technique is becoming rampant in the real estate sector and leading to a remarkable growth in the demand for plasterboard.
Plasterboard Market Challenges:
The greatest challenge faced by the vendors in the plasterboard market is the fact that the old plasterboards need to be replaced by the new ones, and this is majorly attributed to their vulnerability to water contact. Now, due to the sporadic need for replacement, many customers prefer the conventional methods, and it gets difficult for the vendors to convince them about the advantage of plasterboards. However, the regular services offered by the vendors are making them overcome the challenge.
Plasterboard Market Key Players Perspective:
The key players striving to capitalize on the demand influx in the plasterboard market are Armstrong World Industries Inc., Etex Group, Saint-Gobain SA, Georgia Pacific LLC, and Gypsum Management and Supply Inc.
Plasterboard Market Trends:
In October 2017, the gypsum wallboard and suspended ceilings distributor GMS Inc. acquired all the operating assets of Washing Builder’s Supply Company. This was attributed to GMS Inc.’s vision to position itself in the plasterboard market of Pennsylvania.
In January 2018, Etex had become the sole shareholder of Pladur which has plasterboard or gypsum wallboard plant near Madrid, and the company is building its second plant at Gelsa.
Plasterboard Market Research Scope:
The base year of the study is 2018, with forecast done up to 2025. The study presents a thorough analysis of the competitive landscape, taking into account the market shares of the leading companies. It also provides information on unit shipments. These provide the key market participants with the necessary business intelligence and help them understand the future of the plasterboard market. The assessment includes the forecast, an overview of the competitive structure, the market shares of the competitors, as well as the market trends, market demands, market drivers, market challenges, and product analysis. The market drivers and restraints have been assessed to fathom their impact over the forecast period. This report further identifies the key opportunities for growth while also detailing the key challenges and possible threats. The key areas of focus include the types of plasterboard market, and their specific applications in the walls, ceilings, and others. Moreover, the report also digs into the plasterboard’s applications in residential and commercial buildings and how it aids to the plasterboard market growth. Buy Now
Plasterboard Market Report: Industry Coverage
The report analyses the product demands by the form of product – tapered-edged, square-edged, and others. The plasterboard market report also analyzes the major geographic regions as well as the major countries in these regions. The regions and countries covered in the study include:
North America: The U.S., Canada, Mexico
South America: Brazil, Venezuela, Argentina, Ecuador, Peru, Colombia, Costa Rica
Europe: The U.K., Germany, Italy, France, the Netherlands, Belgium, Spain, Denmark
APAC: China, Japan, Australia, South Korea, India, Taiwan, Malaysia, Hong Kong
Middle East and Africa: Israel, South Africa, Saudi Arabia
“We also publish more than 100 reports every month in “Chemicals and Materials”, Go through the Domain if there are any other areas for which you would like to get a market research study.”
Multilayer aluminum composite pipes comprises a composition of polyethylene, polypropylene, and other materials along with aluminum. These Pipes offer the advantages such as high strength and long durability as compared to conventional metallic or plastic pipes. Multilayer Aluminum Composite Pipes have many potential advantages over pipes made from conventional single material, which include high stiffness and strength, good corrosion resistance, light weight and improved thermal resistance properties. The rapid growth of the construction, and electrical and electronics industries in Asian countries has given a huge boost to the global multilayer aluminum composite pipes market. The multilayer aluminum composite pipes market is estimated to grow at a CAGR of 5.7% during the forecast period 2019–2024.
Multilayer Aluminum Composite Pipes Market Outlook
The Multilayer aluminum composite pipes market has been categorized into various segments in the report. On the basis of manufacturing process, the market has been segmented into filament winding and rotary casting. Based on substrate, the market is segmented into (PE) and polypropylene (PP). The polyethylene segment is further sub-segmented into cross-linked polyethylene (PEX), high density polyethylene (HDPE), and others. Based on end-user, the market is segmented into oil and gas industry, construction industry, chemical industry, electrical and electronics, telecommunications and others. The oil and gas industry is further sub-segmented into diesel and petrol, natural gas distribution and others; while construction industry is sub-segmented into residential, commercial and others. The chemical industry is further categorized into chemical processing and others; while electrical and electronics industry is sub-segmented into air conditioning, radiator central heating and others.
Growing construction activities in Asian countries, with India being the front runner.
Increasing number of residential construction projects — Multilayer Aluminum Composite Pipes find major applications in plumbing.
Multilayer aluminum composite pipes are also used for chemical and gas Transportation. Increase in demand for natural gas for electricity production will automatically raise the demand for multilayer aluminum composite pipes.
Raw materials account for nearly 60% of the overall cost of the multilayer aluminum composite pipes where aluminum and PE are the key raw materials for multilayer aluminum composite pipe. However, the rising prices of raw materials pose a major challenge for the growth of the multilayer aluminum composite pipes market. The price of aluminum has increased due to political events such as Rusal sanctions, US-China trade war while the PE prices are expected to witness an uptrend over the medium term.
Multilayer Aluminum Composite Pipes Market Share, By Country, 2018 (%)
Multilayer Aluminum Composite Pipes Market Research Scope
The base year of the study is 2018, with forecast done up to 2024. The study presents a thorough analysis of the competitive landscape, taking into account the market shares of the leading companies. These provide the key market participants with the necessary business intelligence and help them understand the future of the types of Multilayer aluminum composite pipes in the global Multilayer aluminum composite pipes market. The assessment includes the forecast, an overview of the competitive structure, the market shares of the competitors, as well as the market trends, market demands, market drivers, market challenges, and product analysis. The market drivers and restraints have been assessed to fathom their impact over the forecast period. This report further identifies the key opportunities for growth while also detailing the key challenges and possible threats. The key areas of focus include the types of Multilayer aluminum composite pipes and its specific applications in the Multilayer aluminum composite pipes market.
Multilayer Aluminum Composite Pipes Market Report: Industry Coverage
Manufacturing Process of Multilayer Aluminum Composite Pipes: Filament Winding and Rotary Casting.
Substrate of Multilayer Aluminum Composite Pipes: Polyethylene and Polypropylene
End User of Multilayer Aluminum Composite Pipes: Oil and gas, Construction, Chemical, Electrical and electronics, Telecommunications, and Others
Uponor OYJ and Geberit are the two major manufacturers of multilayer aluminum composite pipes.Georg Fischer Ltd ,Geberit, Superpipe Middle East FZCO, Maincor Rohrsysteme Gmbh & Co.Kg and Kitec Industries are the some of the major companies in the multilayer aluminum composite pipes market.
Uponor OYJ, through its broad range of products, constant product launches, and innovation, has been successful in catering to a variety of customers. Monitoring its future business involvements, IndustryARC analysts expect Uponor OYJ to maintain its position in the market.
Countries such as India and China have registered a significant growth of government infrastructural spending, increasing residential and commercial construction, industrial production, irrigation sector and replacement of aging pipelines. Further, the economic outlook for Asia-Pacific region is favorable owing to the large economic developments in China and India. All the major global major players have established their operations in this region. The increasing residential and commercial construction of Asia-Pacific, along with growing economic developments in the region, will drive the growth of multilayer aluminum composite pipes market.
“We also publish more than 100 reports every month in “Chemicals and Materials”, Go through the Domain if there are any other areas for which you would like to get a market research study.”