Power Over Ethernet Market – Forecast(2021 – 2026)

Power over Ethernet Market Overview

Power over Ethernet (PoE) Market was valued at $685.1 million in 2020 and expected to grow at a CAGR of 12.6% during forecast period 2021-2026. PoE is a technology which describes several standard ad-hoc systems that are used for power and data transmission over an existing data connection with a single Ethernet cabling. Low cost, low maintenance, easy installation and less downtime are some of the factors make it more advanced than traditional network power cables. The rising energy cost and adoption of PoE midspans in commercial and industrial sectors for injecting power without affecting the data are expected to surge the overall Power over Ethernet market demand during the forecast period. 

POE injector or midspans enables to carry both data and electricity, thus the Internet-based devices as VoIP phones can work by connecting to just one cable instead for two. The growth of this market is being propelled by the growing demand for PoE-based products such as VoIP phones, IP Cameras, Wireless access points and others. The benefits of VoIP phones such as low cost of communication, ease of installation, and maintenance, among others, have led to the increase in deployment of VoIP phones which will further boost the Power over Ethernet Market during the given forecast period 2021-2026.

Power over Ethernet Market Report Coverage

The report: “Power over Ethernet Market – Forecast (2021-2026)”, by IndustryARC, covers an in-depth analysis of the following segments of the Power over Ethernet Market.

By Type: Power Sourcing Equipment Controllers & ICs, Powered Device Controllers & ICs
By Device Type:  Power Sourcing Equipment, Powered Devices
By Standard: 802.3Af Standard, 802.3At Standard, 802.3Bt Standard
By Application: Connectivity, Security and Access Control, Infotainment, LED Lighting and Control and Others
By End User: Commercial, Industrial, Residential
By Geography: North America (U.S, Canada, Mexico), Europe(Germany, UK, France, Italy, Spain, Russia and Others), APAC(China, Japan India, South Korea, Australia and Others), South America (Brazil, Argentina and others), and ROW (Middle East and Africa)

Key Takeaways

  • North America dominates the Power over Ethernet market owing to high investments and early adoption of advanced
  •  technologies such as IoT and smart buildings.
  • Growing adoption of PoE for smart buildings as it reduces installation costs, offer responsive deployment. It benefits building owners as they are cost effective compared to traditional electrical wiring.
  • High adoption of PoE in smart grids with increasing investments in smart grid infrastructure and its up gradation set to boost the PoE market demand.
  • Limited power capacity and limited distance for data transmission has been hampering the growth of the market. However, high investments and development of new standards and solutions with advancing technologies are creating opportunities for the market growth.

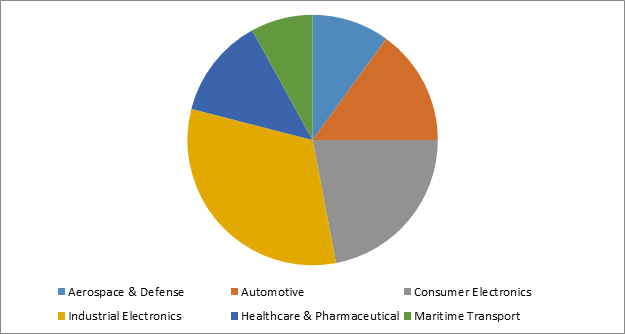
Power over Ethernet Market, By Geography, 2020

.

For More Details on This Report – Request for Sample

Power over Ethernet Market Segment Analysis – By Standard 

802.3Bt Standard holds the major share in Power over Ethernet market at 42% in 2020. Growing demand for high powered devices in order to support smart devices connected to the Ethernet network set to drive the PoE market growth. In 2018, The Institute of Electrical and Electronics Engineers (IEEE) had ratified as in order to meet the power demand of smart buildings and IoT applications. Integration of smart devices has become cost effective with the PoE compared to traditional wiring. 

This standard increases the maximum PoE, and enable multiple and high power management capability. It also enables PoE injectors in order to carry out power and data transmission using large bandwidth to wired and wireless devices such as PTZ security cameras, exterior-mounted IP cameras, and next-generation wireless access points (WAPs), interactive and self-service kiosks and others. This increases the demand for 802.3Bt Standard, thereby driving the PoE market.

Power over Ethernet Market Segment Analysis – By Application 

LED Lighting has been the primary application for Power over Ethernet market and is expected to grow at a CAGR of 13.1% during forecast period 2021-2026. In LED Lighting, PoE can be used to eliminate separate power supplies and additional AC electrical infrastructure to power IP enabled building systems. With growing adoption of IoT technology in industries, there has been wide adoption of LED lighting owing to its high efficiency.

PoE is highly used in simplified deployment of LED lighting as it doesn’t require a home gateway, unlike Zigbee Z-Wave home automation standard, making them ideal for home and industrial automation. Many companies have been introducing PoE solutions for LED lighting applications as it can be easily operated through mobile using internet. For instance, in 2019, Philips Lighting had installed its first-ever Power over Ethernet connected lighting system. This boosts the demand for PoE in LED lighting application, thereby creating opportunities for the market.

Power over Ethernet Market Segment Analysis – By Geography

North America dominated the Power over Ethernet market with a share of 34% in 2020, followed by Europe and APAC. The presence of large number of PoE power sourcing equipment as well as powered device manufacturers in this region set to drive the PoE market. Growing adoption of PoE systems and early adoption of this technology for various commercial and industrial applications have also been pushing the market growth in North America region. High adoption of PoE with increasing adoption of automation and IoT technologies in various industries and growing investments in smart grid infrastructure set to increase the North American PoE market

Power over Ethernet Market Drivers

Adoption of advanced technologies such as Internet of Things (IoT) and Smart buildings

With the implementation of IoT technology, there has been increasing adoption of power over Ethernet systems in various industries which set to drive the market growth. Growing number of connected devices that generate more power, light, and data converged networks in IoT-enabled infrastructure have been escalating the demand for PoE solutions. Additionally, PoE assists in eliminating the need for electric points for the smart sensors that can be integrated on the network at any location. With the help of PoE, smart buildings can utilize a single cable without the need of human touch for powering and communicating with the access points, VoIP networks, IP surveillance cameras, smart lighting luminaries, feature rich video IP phones, other smart devices, and sensors. High adoption of PoE solutions in industries as they are used for high efficiency applications and helps in reducing system cost, thereby driving the market.

Growing adoption of PoE in smart grids

In smart grids, PoE is used to transfer data and power by a single wire to field devices that assists in the optimum consumption of space and effective utilization of data communication technologies. Smart grids need strategic up gradation of network infrastructure in order to support advanced technologies and services. Many countries have been focusing on investments on smart grid which set to drive the market. For instance, in 2020, Ameren which is one of the largest utility companies in the Midwest U.S. has planned to spend $7.6 billion in smart grid technology for five year grid modernization. Increasing adoption of PoE with increasing investments in smart grid infrastructure set to drive the market growth.

Power over Ethernet Market Challenges

Limited Power Capacity hamper the market growth

Power over Ethernet has limited power capacity which hampers the market growth. PoE has capacity to supply ample power to standard pan tilt zoom (PTZ) cameras but they cannot provide sufficient electrical energy for high power consumption devices such as network PTZ cameras which restraints the market growth. In addition to this, usually single PoE power source or switch is connected to multiple powered devices, in this case, if any of the PoE network devices encounter a problem or an issue, there is a chance in which all the devices will stop working. This limits the growth of PoE market.

Power over Ethernet Market Landscape

Product launches, acquisitions and R&D activities are the key strategies adopted by players in the Power over Ethernet market. The market of Power over Ethernet top 10 companies are Microsemi Corp., Linear Technology Corp., Maxim Integrated Products Inc., Cisco Systems, Inc., STMicroelectronics N.V., Texas Instruments Inc., Cree, Inc., Koninklijke Philips N.V. Axis Communications AB, Panasonic Corp., D-Link Corp., and among others.

Acquisitions/Technology Launches

  • In September 2019, STMicroelectronics had launched Power over Ethernet (PoE) controllers for networked devices. These devices have standards of IEEE 802.3af specification for powered devices (PD), which deliver all the control functions that are required to enable a PD to request and draw PoE network through a power source. Introduction of standardized PoE products set to escalate the power over Ethernet market share, thereby driving the market.
  • In January 2019, Microsemi Corporation had introduced PDS-208G PoE switch which is mainly developed for digital ceiling installations. This new device is compatible with IEEE 802.3af or 802.3at PoE lighting fixture and can be installed in ceiling or communication room racks. The company is focusing on introducing advanced PoE products in order withhold its market share.

Buy Now

Related Reports

Ethernet Profinet Market – Forecast(2021 – 2026)

Report Code: ITR 0310

Industrial Ethernet Switch Market – Industry Analysis, Market Size, Share, Trends, Application Analysis, Growth And Forecast 2019 – 2024

Report Code: ESR 99123

For more Information and Communications Technology Market reports, please click here

Curcumin Market – Forecast(2021 – 2026)

Global Curcumin Market OutlookCurcumin is a bright yellow chemical substance belonging to the group of curcuminoids and is the major active compound of turmeric, also found in limited amounts in ginger. It is loaded with anti-inflammatory and anti-oxidation properties which have gained tremendous attention from the nutraceutical industry. Due to its therapeutic properties, curcumin has found enormous opportunities of applications in pharmaceutical, cosmetics, spices, personal care, and F&B sectors. It is rich in mineral content constituting good amount of zinc, magnesium, calcium, iron, and potassium, and also acts as powerful natural antioxidant with no side effects due to the presence of Vitamin-C in it. As per the IndustryARC business intelligence report, the global curcumin market size was around $56 million to $58 million in 2018 and is forecast towards progression at a global CAGR of 9% to 10% during the forecast period (2019-2025).
In 2018, the United Natural Products Alliance signed a memorandum of understanding with the Global Curcumin Association. Such undertakings by elite organizations have tremendous potential to advance consumer confidence, manufacturing principles, and obedience with federal regulations along with guidelines concerned with natural products elements and nutritional supplements. These events with their enormous influencing tendencies is all set to divert a huge chunk of traffic towards the global curcumin market, stroking it with demand and opportunities for hefty returns.

Curcumin Market

Global Curcumin Market- Application Analysis:

  • As per a 2018 report by Blue Cross Blue Shield Alliance diagnoses of major depression have increased intensely by 33 percent since 2013 in the United States affecting 9 million Americans. Global situation assessment by WHO reveals more than 300 million people of all age-groups suffer from depression. Curcumin is a natural antidepressant and as effective as medicines in the cases of alleviating depression symptoms. Owing to such peculiarities and demand for medications treating depression, the untapped curcumin marketplace is poised for exponential growth.
  • Circumin is a natural inflammatory compound that helps the body to fight natural invaders and also enhances damage repairing process. It is a powerful ingredient with all the medicinal traits to fight chronic inflammation—all this with no side effects. The compound also shows promise of support medication formulations of several chronic diseases such as cancer, cardiovascular diseases, metabolic syndrome, alzheimer and so on.
  • WHO states that 17.9 million people die every year due to cardiovascular diseases (CVDs), which accounts for 31% of the global deaths. Moreover, depression and unhealthy diet are the major causes recognized for CVDs by the organization. Thus, curcumin with impeccable medicinal qualities and nutritional qualities useful in condition like depression, obesity and CVDs is forecast to stroke the market towards tremendous growth at a global stage. Pharmaceuticals applications segment accounts for more than half of the global revenue share of curcumin market and is forecast to progress at a CAGR of 8%-9% from 2019 to 2025.
  • As per an analysis by Forbes, the global cosmetic industry sales reached $445 billion in 2017.  At present, huge chunk of demand in this arcade is for products made with natural ingredients as a consequence of awareness campaigns regarding the hazardous effects like skin cancer by chemical cosmetic ingredients. Curcumin with its powerful antioxidants potentials determines itself as an asset towards controlling mechanisms like anti-aging. The cosmetics industry is leveraging key traits of curcumin to formulate their products and gain ground over competitors.

R&D Investments Positively Influencing Curcumin Market:

Innovations and technology is leading the way towards understanding the full potential of traditional herbs and its effects on health. Indian and Chinese markets with traditional Indian Ayurveda and traditional Chinese medicines have been utilizing curcumin from a very long time. But at present, North America is the leading market controlling 53% – 55% of the global curcumin market share, owing to numerous ongoing R&D activities reflecting the immaculate potential of curcumin in various sectors like F&B, personal care and cosmetics, pharmaceuticals and nutraceuticals industries. Global Curcumin Association depicted that research and scientific validation on the health benefits of curcumin has been a major influence in the popularity of this ingredient.
Some of the major companies profiled in the report are Biomax Lifesciences Ltd. (India), Synthite Industries (India), Hebei Food Additive Co. Ltd. (China), Helmigs Prima Sejahtera PT (Indonesia) and others.
Rampant trend of healthier lifestyle is leading to influx of investments on natural products, such as curcumin. The organic compound has proven its worth as antidepressant as well as usage in the pharmaceutical, cosmetics, and personal care industries. Thus, urban population with increasing health awareness and deterring medical conditions are expected to propel the curcumin market in the near future. Association agreements with elite organizations acts as a free advertising tool among masses and it also affects the commodity’s image to propel the market growth. 
For more Consumer Product and Services related reports, please click here

European Printed Circuit Board Market – Forecast(2021 – 2026)

European Printed Circuit Board Market OverviewEuropean Printed Circuit Board market is analyzed to grow at a CAGR of 2.02% during the forecast period 2021-2026 to reach $17952.02 million. A printed circuit board or PCB is generally used for electrically connecting various electronic components be it capacitors, resistors, diodes and so on, and is considered to be the building block for modern electronic devices. Deployment of PCBs had proved essential in serving demanding application areas for various end-use industries be it consumer electronics, healthcare, automotive, and so on. Increasing shift towards supporting electric vehicles growth across European countries along with leveraging advanced technologies like AI or IoT have been considered as some of the prominent drivers for the growth of European Printed Circuit Board market. Moreover, rise of healthcare investments, growing consumption of consumer electronic products and many others are further analyzed to propel the need for PCBs in the long run.

European Printed Circuit Board Market Report Coverage

The report: “European Printed Circuit Board Industry Outlook – Forecast (2021-2026)”, by IndustryARC covers an in-depth analysis of the following segments of the European Printed Circuit Board industry. By Board Type: Rigid 1-2 Sided, Standard Multilayer, HDI/Microvia/Build-up, IC Substrate, Flexible Circuits, Rigid Flex, OthersBy Materials Used: Copper, Tin, Nickel, Iron, Lead, Aluminum, Zinc, Silver, Gold, Palladium, Bismuth, Chromium, OthersBy Components: Capacitors, Diodes, Integrated Circuits, Resistors, OthersBy End Users: Aerospace & Defense, Automotive, Industrial Electronics, Consumer Electronics, Maritime Transport, Healthcare & PharmaceuticalBy Country: Nordics, U.K, Germany, France, Italy, Spain, Benelux, Switzerland, Austria, Others.

Key Takeaways

  • Growing shift towards electric vehicles in Europe along with technological advancements like AI and IoT is analyzed to significantly drive the European Printed Circuit Board market during the forecast period 2021-2026.
  • Industrial Electronics had accounted for the largest market share in 2020, attributed to the factors including growing demand for industrial robots, shift towards industrial automation and so on.
  • Presence of some of the key market players such as Schweizer Electronik AG, Wurth Electronik GmbH & Co. KG and many others have helped in boosting the market growth of PCBs in Germany.

European Printed Circuit Board Market, By End User, 2020

For More Details on This Report – Request for Sample

European Printed Circuit Board Market Segment Analysis- By Components 

By components, European Printed Circuit Board market is segmented under Capacitors, Diodes, Integrated Circuits, Resistors and Others. Integrated Circuits had dominated the European Printed Circuit Board market with $2260 million in 2020, analyzed to grow significantly with a CAGR of 2.75% during the forecast period 2021-2026. Integrated circuits (IC) can be referred as an assembly of electronic components like resistors, capacitors, transistors and so on in miniature form fabricated upon a semiconductor substrate. Owing to its high efficiency and reliability, devices ranging from computer, cell phones, televisions, digital watches and many others have been highly utilizing the small-sized ICs within PCB boards. Factors such as rising penetration of smartphones, growing demand towards portable wireless devices as well as investments towards electric vehicles and so on can be considered as some of the vital factors impacting the need for integrated circuits across the European PCB market. Various leading companies including Ford, Volkswagen, Porsche and many others have continued their investments towards supporting the development of electric automotives within the European countries, which are bound to propel the need for integrated circuits in the long run. 

European Printed Circuit Board Market Segment Analysis- By End Users

By End Users, the European Printed Circuit Board market is segmented under automotive, consumer electronics, industrial electronics, healthcare & pharmaceutical, aerospace & defense as well as maritime transport. Industrial Electronics had dominated the European Printed Circuit Board market with $6564.48 million in 2020, and is analyzed to grow with the highest CAGR of 2.78% during the forecast period 2021-2026. Printed circuit boards or PCBs serve as an integral part of high-powered industrial applications including transformers, digital meters, wireless communication devices, power monitoring, visual signaling devices and many others. Due to installation of various electronic components within PCBs, they are capable of controlling as well as operating a number of mechanisms or processes be it packaging, transportation, and so on across different industry verticals like process industries, chemicals and many others. In addition, PCBs have gained wide popularity across industrial applications due to being unaffected from vibrating machinery, exposure to harmful chemicals or substances, and so on while helping the manufacturers to optimize plant operational efficiency with increasing industrial automation. According to International Federation Robotics, the European operational stock for industrial robots had reached 580,000 units in 2019, showing an increase of 7% from previous year, with Germany, Italy, France and U.K being the top contributors. This shows growing adoption of industrial robots in order to increase automation across various industries within European countries, thereby affecting the demand for PCBs. 

European Printed Circuit Board Market Segment Analysis – By  Country

Germany had accounted for the largest share of $3633.9 Million in 2020, followed by U.K and France, and is analyzed to grow significantly with a CAGR of 3.30% in the European Printed Circuit Board market during the forecast period 2021-2026. Factors like growing investments towards autonomous vehicles or electric vehicles, rising demand towards consumer electronic products and so on can be considered as some of the prime factors which had attributed towards the market growth of PCB in Germany. Presence of some of the key leaders such as Schweizer Electronik AG, Wurth Electronik GmbH & Co. KG and many others have also helped in boosting the growth of PCBs across the country. High investments towards semiconductor chip manufacturing as well as rising demand towards medical equipment or devices are set to create new opportunities for the PCB within the country. In 2020, German government had placed several orders with different manufacturers at a short notice in order to ensure supply of medical ventilators for COVID-19 patients within the country. In response to this, Wurth Electronik announced about supplying PCBs required for rapid manufacturing of intensive care as well as mobile ventilators from its Germany based production sites. Owing to growing demands of ventilators in the country, the move towards PCB supply from key market vendors had eventually created a positive impact in the growth of PCB for the medical sector. In 2021, one of the leading automotive companies, Ford announced about investing an amount of $1 billion for building a new electric vehicle manufacturing facility in Cologne, Germany. 

European Printed Circuit Board Market Drivers 

Technological advancements such as artificial intelligence or IoT will drive the market forward:

Technological advancements such as artificial intelligence or IoT acts as one of the major drivers and is further analyzed to drive the growth of European Printed Circuit Board market during the forecast period. Introduction of advanced technologies like artificial intelligence (AI) or IoT have proved beneficial for the manufacturers towards designing, verification as well as testing of PCBs within low costs and shorter time intervals. Leveraging AI helps in determining the component placement more accurately and precisely, improving PCB performance reducing assembling time in comparison to conventional designed PCBs. With growing advancements, there is significant demand towards compact sized PCB designs, thereby creating wider adoption of AI by the manufacturers to offer a higher degree of accuracy during smaller component placement. Moreover, utilization of such advanced technologies helps in offering customization benefits, optimum power efficiency and so on. In 2021, a British company, Novocomms announced about the launch of a flexible printed circuit board antenna, named FPCB LTE 4G, as an addition to their patented multi-channel antennas for Internet of Things (IoT) sector. This development of flexible PCB was done to offer a fully customizable cable which can be adapted for responding low, mid or high bands, while serving growing demands for IoT devices particularly across medical sector. 

Growing shift towards electric vehicles in Europe:

Growing shift towards electric vehicles in Europe can be considered as one of the major driving factors impacting the growth of European Printed Circuit Board market. With the move towards supporting the shift to electrically powered cars or vehicles across several European countries, the demand for PCBs are tend to rise owing to serving demanding automotive applications. Development of electric or autonomous vehicles involves the need for PCBs in application areas like ADAS systems, infotainment systems and battery control systems along with other intelligent devices. Since PCBs are helpful in optimizing driving efficiency or battery management systems, making it one of the essential factors for adoption in electric vehicles. In electric vehicles, there is significant deployment of various sensors, transmitters, diodes and so on which requires precised and accurate control for optimizing safety standards, reducing excessive battery consumption with others, thereby affecting the need for printed circuit boards or PCBs. According to European Automobile Manufacturers Association, hybrid electric vehicles contributed to about 18.4% of total passenger car sales in the EU, additionally showing the growing demand towards electrically chargeable cars. Since the electric vehicles primarily constitute of motor controller circuitry built on PCBs, this growth of electric car sales within European Union is bound to drive the need for automotive PCBs in the long run. In 2019, European governments announced about forming an alliance with companies in order to develop next-generation batteries for electric vehicles through an investment of around 5-6 billion Euros (USD 6.7 billion). This initiative was taken by German and French government for helping European automakers to ramp up electric vehicle production, thereby creating a positive impact on the growth of PCBs.

European Printed Circuit Board Market Challenges

Stringent governmental regulations like European RoHS directive compliance:

Stringent governmental regulations like European RoHS directive compliance for the manufacturers can be considered as one of the major factors impeding the market growth of PCB across European region. Since manufacturing of PCBs generate massive amounts of wastes which cannot be recycled, this act as a major factor adversely impacting its market growth in Europe. PCB manufacturers need to mandatorily comply by the RoHS directives set by the government which aims at restricting the use of specific hazardous materials like lead, cadmium, chromium and others while producing various electronic components used in PCB. This regulatory compliance becomes highly essential for the manufacturing companies to ensure distribution across European countries. Additionally, hazardous waste disposal regulations imposed by regulatory bodies of Europe also tends to adversely impact the market growth of PCBs. In accordance with the waste disposal regulations, manufacturers need to enhance the waste disposal processes, while raising additional production costs, eventually hampering the market growth towards PCB electronic components within Europe.

European Printed Circuit Board Market Landscape

Product launches, acquisitions, and partnerships are key strategies adopted by players in the European Printed Circuit Board market. The key players in the European Printed Circuit Board market include Fineline Ltd., ICAPE Group, NCAB Group Corporation, Schweizer Electronic AG, Wurth Elektronik GmbH & Co. KG, AT & S Austria Technologie & Systemtechnik AG, Somasis, Mektec Europe AG, Unimicron (United Microelectronics Corporation), Elvia Group among others.
Buy Now

Acquisitions/Technology Launches/Partnerships

  • In January 2021, NCAB Group had completed the acquisition of PreventPCB in Italy, for which the combined net sales of PreventPCB and NCAB Italy amounted to approximately $29.59 million.
  • In August 2020, Schweizer Electronic AG and Varikorea Co., Ltd. had entered into a sales representative agreement for South Korea, under which Varikorea will be promoting SCHWEIZER’s high-tech printed circuit boards as well as embedding solutions within the territory. 

Related ReportsPrinted Circuit Board Market & Recyclable PCB Market – Forecast(2021 – 2026)Report Code: ESR 0006
PCB Design Software Market – Forecast(2021 – 2026)Report Code: ESR 0094
For more Electronics Market reports, please click here

Wood Preservative Market – Industry Analysis, Market Size, Share, Trends, Application Analysis, Growth and Forecast 2020 – 2025

Overview

Wood Preservative Market is forecast to reach $2.04 billion by 2025, after growing at a CAGR of 5.2% during 2020-2025. Growing demand for wood in different applications and increasing awareness of wood preservative benefits has resulted in increased demand for wood preservative. Additionally, advances in technology and increasing adoption of environmentally friendly preservatives are some of the other factors that boost market growth.

Report Coverage

The report: “Wood Preservative Market – Forecast (2020-2025)”, by IndustryARC, covers an in-depth analysis of the following segments of the Wood Preservative Market.

Key Takeaways

  • Increased use of wood for interior decoration, rapid urbanization in emerging countries and higher levels of consumer spending are some of the major drivers propelling the market growth.
  • In the residential sector, wood preservatives are highly used to enhance the life of wood structures and wood decorations. The residential sector is thus growing more rapidly.
  • North America dominated the wood preservatives market owing to the extensive usage of wood in the residential sector.

By Formulation – Segment Analysis

The water-based segment held the largest share in the wood preservative market in 2019. Water-based wood preservatives have superior properties compared to other formulations, including high performance and long processing periods. During the forecast period, these properties are expected to drive this segment. In the forecast period, these properties are expected to drive this segment. Water based preservatives are mostly used in residential commercial applications. It’s suitable for all applications. Compared to other formulations, this preservative provides better environmentally friendly properties. Increasing demand from emerging economies for water-based preservatives is high

Application Type – Segment Analysis

The residential application segment exhibited the largest share of the global wood preservative market in 2019 and is growing at a CAGR of 4.9%. This is due to the increasing demand for wood from the flooring and wooden furniture infrastructure market. In addition, the increasing popularity of wood as a renewable and sustainable construction material with the lowest carbon footprint has resulted in its widespread use in the construction industry. This is another factor that is driving the growth of the market.

Geography – Segment Analysis

In 2019, North America dominated the market for wood preservatives, representing a share of 35%. This is due to the extensive use of wood in the region’s residential sector. In addition, factors such as technological developments and industry participants ‘ strategic initiatives support the growth of the market

Asia-Pacific is witnessing the highest growth rate over the forecast period. Growth in this region is attributed to rising living standards, increased commercial housing, and increased industrial construction in developing economies like China, India. For instance, according to the G-20 Global Infrastructure Outlook, infrastructural investment is about 6.45% of GDP in developing countries like China. Thus, due to countries ‘ increased focus on infrastructure development, the market is expected to grow at a steady rate. In addition, increasing investment in premium furniture backed by rising living standards, especially among the middle-class population, is expected to drive market growth in the region.

Drivers – Wood Preservative Market

  • Increasing demand for wood preservatives due to a shift in consumer preference towards the use of eco-friendly wood preservatives

Demand for wood preservatives is growing due to a shift in consumer preference to the use of environmentally friendly wood preservatives. For instance, the new generation compound Ammonium Copper Quaternary (ACQ) is widely used as an alternative to the wood preservatives Chromated Copper Arsenate (CCA). ACQ is used in agricultural poles and structural timber for wood processing. It helps to improve the durability of the treated wood.

  • Changing lifestyle and rising purchasing power lead to increased spending on home and office wood-based decoration.

Wood preservative demand benefits from an improved economy, changing lifestyles, and increasing construction spending. Residential and non-residential construction markets will see the fastest growth, boosting progressive demand in applications such as decking, landscaping, lumber framing, fire protection, and timber treatment. For applications such as decking, utility poles, and marine piling, the non-building construction industry will see healthy growth and lead to increased demand.

Challenges – Wood Preservative Market

  • Increasing Restrictions on the use of synthetic wood preservatives and hazardous chemicals such as chromium and arsenic.

Environmental agencies ‘ bans on the use of some wood preservatives such as CCA, creosote, and pentachlorophenol in some applications which acts as a limitation on market growth. For instance, Directive 2003/EC in Europe prohibits the use and marketing of arsenic and CCA wood preservatives and the use of CCA treated wood in domestic and residential buildings. This further restricts growth of the global wood preservatives market.

  • Availability of Substitutes

Growth in alternative materials such as wood-plastic composites, steel, iron, and plastics that are highly durable and require less maintenance is perceived to be a major limiting factor for this market. Such substitutes are intended to reduce the use of wood across end-use industries and have a negative impact on the market for wood preservatives.

Market Landscape

Technology launches, acquisitions and R&D activities are key strategies adopted by players in the Wood Preservative Market. In 2019, the market of wood preservative has been consolidated by the top five players accounting for xx% of the share. Major players in the Wood Preservative Market are BASF Wolman GmbH, U.S. Borax Inc., Cooper Care Wood Preservatives Inc., Dattashri Enterprises, Dolphin Bay, Janssen Pharmaceutica NV, Jubilant Agri and Consumer Products Limited, KMG Chemicals, Koppers Inc., Kurt Obermeier GmbH & Co. KG., Lada Organics Pvt. Ltd., Lanxess AG, Lonza Group and Quality Borate Company, among others.

Buy Now

Acquisitions/Technology Launches

  • Tanalised launched “E Wood Treatment Plant” in January 2016, which helps to increase the demand for wood treatment in an environmentally friendly manner.
  • In January 2016, Troy Corporation introduced a wet-state preservative Mergal GLT25 & GLT50 that provides protection in aqueous systems against bacteria and fungi. Mergal has a wide range of applications in applications for automotive and metalworking fluids

Vehicle Tracking System Market – Industry Analysis, Market Size, Share, Trends, Application Analysis, Growth And Forecast 2020 – 2025

OverviewVehicle tracking system market size is forecast to surpass $14.6 billion by 2025 growing at CAGR 14% during 2020-2025 owing to the growing demand for the live tracking for transit and passenger transportation services globally. Apart from this, the increase in adoption of fleet management in the e-retail space to enhance customer experience by availing real time package tracking to assist the market growth during the forecast period
Report CoverageThe report: “Vehicle Tracking System Market Report – Forecast (2020-2025)”, by IndustryARC, covers an in-depth analysis of the following segments of the Vehicle tracking system Market.  Key Takeaways

  • Active vehicle tracking system to dominate the market as well as grow at the highest rate during 2020-2025 owing to the increasing preference to live mobile vehicle tracking 
  • Passenger vehicle acquired the major share of the  vehicle tracking system market owing to the adoption of usage based insurance and growing passenger transport fleet operators
  • Retail vehicle tracking system market segment to witness the highest growth during 2020-2025 due to the increase in the influx of e-retail companies in the market space
  • APAC to witness the highest growth during the forecast period due to the rise of ride sharing and rental rides companies in the emerging economies 

Product Type – Segment AnalysisActive vehicle tracking system market held the majority of the share in 2019 and is also estimated to grow at the highest rate during 2020-2025 owing to the increase in demand for passenger ride services for office commutation and general commutation with mobile based live tracking of the vehicles. 
Vehicle Type – Segment AnalysisBy vehicle type, the global vehicle tracking system market has been segmented by commercial and passenger vehicle. The passenger vehicle tracking system market held the major share of the market in 2019 owing to the broad based of fleet operators in developed economies and rapid increase of the same in emerging economies. The commercial vehicle segment is set to witness the highest growth during 2020-2025 owing to the increase in penetration of fleet management in the commercial transportation and logistics segment which mandates the incorporation of tracking systems in the vehicle to geofencing, asset tracking, fleet monitoring and other applications. The rise in rental self-drive vehicle demand and increase in usage based insurance in this sector is set to assist the market growth for vehicle tracking system during 2020-2025
Industry Vertical- Segment AnalysisThe various industry verticals comprehended in the global vehicle tracking system market includes transportation and logistics, construction, retail, government and others. Retail vehicle tracking market is set to witness the highest growth of CAGR 16% during 2020-2025 owing to the rapid increase in the entry of companies in the e-retail sector. Since these offer live package tracking of the deliveries, the demand for vehicle tracking systems is also set to grow as these systems will be incorporated by the in-city logistics fleet. 
Geography – Segment AnalysisNorth America acquired the significant share of 40% of the global vehicle tracking system market in 2019 owing to the major users of fleet management for commercial vehicles in the transportation and logistics vertical. APAC is also set to witness the highest growth during 2020-2025 owing to the broad passenger vehicle user base, increase in the entry of ride sharing and rental car companies during the forecast period. 
Some of the biggest rental car startups across the globe includes eHI Car Services, Zuche, PPzuche, Reocar, Turo, Atzuche, iCarsclub, Zipcar, Silvercar, Drivy, Zoom Car and so on. The growing rental car startups across the globe is set to drive the vehicle tracking system market during the forecast period

Drivers – Vehicle Tracking System Industry Trends

  • The growing use of fleet management solutions

With the growing adoption of fleet management solutions in the commercial fleet tracking applications, has been analyzed to drive the demand for vehicle tracking system for vehicle monitoring, fuel management, compliance management, driving behavior, maintenance management and so on. The growing fleet size in the logistics and transportation vertical for intercity and in-city goods transport is set to play a major role in driving the adoption of various tracking systems based on GLONASS and GPS tracking thereby assisting the market growth during 2020-2025. 
Challenges – Vehicle Tracking System Market

  • Growing adoption of Smartphones

The growing number of smartphones across the globe is set to impose a severe challenge to the vehicle tracking system market. Smartphones feature inbuilt GPS positioning and navigation system which can be used as an alternative to vehicle tracking system. Apart from this, the growing use of smartphone applications for vehicle tracking, driver activity tracking and so on to further increase the impact of the challenge during the forecast period 2020-2025
Market LandscapeThe vehicle tracking system market share analysis includes an in-depth assessment of the players operating in the market based on company size, global reach, product portfolio and various others. The Vehicle Tracking System top 10 companies includes Continental Ag, Delphi Automotive, Magna International Inc, Robert Bosch Gmbh, ATrack Technology Inc, Maestro Wireless Solutions Ltd., Comm-Port Technology, Teletrac Navman US Ltd, CalAmp Corp., Orbocomm Inc. and so on. The vehicle tracking system market has been analyzed to be fragmented with the degree of competition in the market owing to the high concentration of major as well as local suppliers
Buy Now
Product Launch and Acquisition

  • In July 2018, U-blox and Arvento Mobile Systems launched the imt.x1 vehicle tracking system, which uses U-blox’s positioning technology to detect panic braking
  • In November 2018, U‑blox and ERM Advanced Telematics, a provider of device based telematics systems, launched  StarLink TrackerWi‑Fi, a vehicle-tracking device with built-in Wi‑Fi hotspot
  • In July 2019, Ford Motor Company announced the acquisition of Journey Holding Corporation, for its vehicle tracking software and app-based technology for enhancing its mobility business services

Vehicle Tracking System Market – Industry Analysis, Market Size, Share, Trends, Application Analysis, Growth And Forecast 2020 – 2025

OverviewVehicle tracking system market size is forecast to surpass $14.6 billion by 2025 growing at CAGR 14% during 2020-2025 owing to the growing demand for the live tracking for transit and passenger transportation services globally. Apart from this, the increase in adoption of fleet management in the e-retail space to enhance customer experience by availing real time package tracking to assist the market growth during the forecast period
Report CoverageThe report: “Vehicle Tracking System Market Report – Forecast (2020-2025)”, by IndustryARC, covers an in-depth analysis of the following segments of the Vehicle tracking system Market. 

 Key Takeaways

  • Active vehicle tracking system to dominate the market as well as grow at the highest rate during 2020-2025 owing to the increasing preference to live mobile vehicle tracking 
  • Passenger vehicle acquired the major share of the  vehicle tracking system market owing to the adoption of usage based insurance and growing passenger transport fleet operators
  • Retail vehicle tracking system market segment to witness the highest growth during 2020-2025 due to the increase in the influx of e-retail companies in the market space
  • APAC to witness the highest growth during the forecast period due to the rise of ride sharing and rental rides companies in the emerging economies 

Product Type – Segment AnalysisActive vehicle tracking system market held the majority of the share in 2019 and is also estimated to grow at the highest rate during 2020-2025 owing to the increase in demand for passenger ride services for office commutation and general commutation with mobile based live tracking of the vehicles. 
Vehicle Type – Segment AnalysisBy vehicle type, the global vehicle tracking system market has been segmented by commercial and passenger vehicle. The passenger vehicle tracking system market held the major share of the market in 2019 owing to the broad based of fleet operators in developed economies and rapid increase of the same in emerging economies. The commercial vehicle segment is set to witness the highest growth during 2020-2025 owing to the increase in penetration of fleet management in the commercial transportation and logistics segment which mandates the incorporation of tracking systems in the vehicle to geofencing, asset tracking, fleet monitoring and other applications. The rise in rental self-drive vehicle demand and increase in usage based insurance in this sector is set to assist the market growth for vehicle tracking system during 2020-2025
Industry Vertical- Segment AnalysisThe various industry verticals comprehended in the global vehicle tracking system market includes transportation and logistics, construction, retail, government and others. Retail vehicle tracking market is set to witness the highest growth of CAGR 16% during 2020-2025 owing to the rapid increase in the entry of companies in the e-retail sector. Since these offer live package tracking of the deliveries, the demand for vehicle tracking systems is also set to grow as these systems will be incorporated by the in-city logistics fleet. 

Geography – Segment AnalysisNorth America acquired the significant share of 40% of the global vehicle tracking system market in 2019 owing to the major users of fleet management for commercial vehicles in the transportation and logistics vertical. APAC is also set to witness the highest growth during 2020-2025 owing to the broad passenger vehicle user base, increase in the entry of ride sharing and rental car companies during the forecast period. 
Some of the biggest rental car startups across the globe includes eHI Car Services, Zuche, PPzuche, Reocar, Turo, Atzuche, iCarsclub, Zipcar, Silvercar, Drivy, Zoom Car and so on. The growing rental car startups across the globe is set to drive the vehicle tracking system market during the forecast period
Drivers – Vehicle Tracking System Industry Trends

  • The growing use of fleet management solutions

With the growing adoption of fleet management solutions in the commercial fleet tracking applications, has been analyzed to drive the demand for vehicle tracking system for vehicle monitoring, fuel management, compliance management, driving behavior, maintenance management and so on. The growing fleet size in the logistics and transportation vertical for intercity and in-city goods transport is set to play a major role in driving the adoption of various tracking systems based on GLONASS and GPS tracking thereby assisting the market growth during 2020-2025. 
Challenges – Vehicle Tracking System Market

  • Growing adoption of Smartphones

The growing number of smartphones across the globe is set to impose a severe challenge to the vehicle tracking system market. Smartphones feature inbuilt GPS positioning and navigation system which can be used as an alternative to vehicle tracking system. Apart from this, the growing use of smartphone applications for vehicle tracking, driver activity tracking and so on to further increase the impact of the challenge during the forecast period 2020-2025
Market LandscapeThe vehicle tracking system market share analysis includes an in-depth assessment of the players operating in the market based on company size, global reach, product portfolio and various others. The Vehicle Tracking System top 10 companies includes Continental Ag, Delphi Automotive, Magna International Inc, Robert Bosch Gmbh, ATrack Technology Inc, Maestro Wireless Solutions Ltd., Comm-Port Technology, Teletrac Navman US Ltd, CalAmp Corp., Orbocomm Inc. and so on. The vehicle tracking system market has been analyzed to be fragmented with the degree of competition in the market owing to the high concentration of major as well as local suppliers
Product Launch and Acquisition

  • In July 2018, U-blox and Arvento Mobile Systems launched the imt.x1 vehicle tracking system, which uses U-blox’s positioning technology to detect panic braking
  • In November 2018, U‑blox and ERM Advanced Telematics, a provider of device based telematics systems, launched  StarLink TrackerWi‑Fi, a vehicle-tracking device with built-in Wi‑Fi hotspot
  • In July 2019, Ford Motor Company announced the acquisition of Journey Holding Corporation, for its vehicle tracking software and app-based technology for enhancing its mobility business services

Buy Now

Topical Pain Relief Market – Industry Analysis, Market Size, Share, Trends, Application Analysis, Growth And Forecast 2021 – 2026

  Topical Pain Relief Market size is forecast to reach $11.78 billion by 2025, growing at a CAGR of 6.25% during the forecast period 2020-2025. Topical Pain Relief is designed to relieve pain that is sprayed on, rubbed in, or applied as patches onto the skin over painful muscles or joints. An increase in the prevalence of arthritis and other bone-related conditions are the major factors driving the growth of the market. Rising geriatric population and the increase in the adoption of topical pain relief by sports players is set to further enhance the overall market demand for topical pain relief during the forecast period 2020-2025.

Report Coverage

The report: “Topical Pain Relief Market Forecast (2020-2025)”, by IndustryARC, covers an in-depth analysis of the following segments of the Topical Pain Relief Market. 
By Type: Prescription Pain Relief, Over-The-Counter Pain ReliefBy Therapeutic Class: Non-Opioids, Nonsteroidal Anti-Inflammatory Drug, Methyl Salicylate, Capsaicin, Lidocaine, Opioids, Buprenorphine and FentanylBy Formulation: Cream, Gel, Spray, and PatchBy Distribution Channel: Pharmacy Drug Store, E-Commerce, OthersBy Geography: North America, Europe, Asia Pacific and Rest of the World (RoW)

Key Takeaways

  • North America dominated the Topical Pain Relief Market in 2019 owing to the rising geriatric population and increasing incidences of sports injury. The Topical Pain Relief Market scope for different regions will be provided in the final report.
  • Increase in demand for topical pain relief by sports players and rise in adoption of topical pain relief is likely to aid in the market growth of the topical pain relief market.
  • Detailed analysis of the Strength, Weakness, and Opportunities of the prominent players operating in the market will be provided in the Topical Pain Relief Market report.
  • Topical Pain Relief Medications can irritate skin and odor or unpleasant smell of topical pain relief is set to create hurdles for the Topical Pain Relief Market.

Therapeutic Class- Segment Analysis

The non-Opioids segment held the largest share in the Topical Pain Relief in 2019 and is estimated to grow at a CAGR of 5.41% during the forecast period 2020-2025.This is owing to the high preferability and availability of non-opioids drugs. Nonopioids are further segmented into   Nonsteroidal Anti-Inflammatory Drug,   Methyl Salicylate,   Capsaicin, and Lidocaine. Lidocaine is a local anesthetic that works by causing temporary numbness or loss of feeling in the skin and mucous membranes. Topical non-steroidal anti-inflammatory drugs provide good levels of pain relief in acute conditions such as sprains, strains, and overuse injuries, probably similar to that provided by oral nonsteroidal anti-inflammatory drugs. The tricyclic antidepressants most commonly used in the treatment of neuropathic pain are amitriptyline, imipramine, nortriptyline, and desipramine, as they all are potent norepinephrine reuptake inhibitors. Capsaicin topical is used for temporary relief of muscle or joint pain caused by strains, sprains, arthritis, bruising, or backaches. Capsaicin topical is also used to treat nerve pain (neuralgia) in people who have had herpes zoster or shingles. Cannabinoid receptors and endocannabinoids are present in pain circuits from the peripheral sensory nerve endings up to the brain. Cannabinoid receptor agonists modulate nociceptive thresholds by regulating neuronal activity, but they also relieve pain by acting on non-nervous tissues. The Non-Opioids is set to be the highest growing segment and is estimated to register highest CAGR during the forecast period 2020-2025.

Distribution Channel – Segment Analysis

E-Commerce segment held the largest share in the Topical Pain Relief in 2019 owing to the significant increase in digital literacy among the global population. Large population and surge in awareness about topical pain relievers among patients, rise in prevalence of diseases associated with chronic pain among the population, high awareness about the side effects caused by systemic administration of drugs and increase in the number of people suffering from migraine and schizophrenia are boosting the growth of the topical pain relief market. E-Commerce is set to be the highest growing segment and is estimated to register the highest CAGR during the forecast period 2020-2025.

Geography – Segment Analysis

North America dominated the topical pain relief market in 2019 with a share of more than 37.6% followed by the Asia Pacific. This is owing to the high population base, increase in disposable income, and improvement in patient awareness about topical pain relief products. High awareness about the side effects caused by systemic administration of drugs and an increase in the number of people suffering from migraine & schizophrenia along with the awareness and improvement in access of healthcare medication & education is set to increase the growth of the topical pain relief market in the North America region.However, Asia-Pacific is estimated to grow at a higher CAGR during the forecast period 2020-2025 owing to the rise in prevalence of chronic diseases including cancer, arthritis, and diabetes among others coupled with the increase in investments by various multinational companies. An increase in the old age group population and unhealthy food habits with the rise in awareness among patients about the adverse effects of particular drugs and associated pathways, increase in the number of patients undergoing prolonged treatment for diseases such as skin cancer is set to increase the growth of the topical pain relief market in the Asia Pacific region.

Drivers – Topical Pain Relief Market

Increase in prevalence of arthritis and other bone-related conditions

An increase in the prevalence of arthritis and other bone-related conditions is increasing the growth of the topical pain relief market owing to the development of an online platform for the topical therapeutics and high potential in untapped markets in the emerging economies.  The rise in prevalence of chronic diseases including cancer, arthritis, diabetes, growing demand in sports and athletic player, growing awareness of online pharmacy and others along with an increase in investments by various multinational companies and high demand for topical pain relievers among athletes and lesser side effects as compared to conventional oral medicines. Thus, increasing the growth of the topical pain relief market during the forecast period 2020-2025.

Increase in geriatric population and the increase in the adoption of topical pain relief by sports players

Increase in geriatric population and the increase in the adoption of topical pain relief by sports players are increasing the growth of the topical pain relief market owing to the rise in adoption of topical pain relief products as they cause lesser side effects as compared to oral pain relief, upsurge in geriatric population across the world, increase in disposable income, and improvement in patient awareness about topical pain relief products and increase in demand for topical pain relief by sports players. Thus, increasing the growth of the topical pain relief market during the forecast period 2020-2025.

Challenges – Topical Pain Relief Market

Topical pain relief medications can cause irritate skin and they have a strong odor or unpleasant smell  

Some of the factors which can impede the growth of the topical pain relief market are it causes irritated skin and they have a strong odor or unpleasant smell.

Topical Pain Relief Industry Outlook

Product launches, mergers and acquisitions, joint ventures and R&D activities are key strategies adopted by players in the topical pain relief market. In 2019, Topical Pain Relief Market share is consolidated by the top ten players present in the market. Topical Pain Relief, top 10 companies are Advacare Pharma, Glaxosmithkline Plc, Johnson Johnson, Nestl S A, Pfizer Inc., Reckitt Benckiser Group Plc, Sanofi, Sun Pharmaceutical Industry Ltd and Topical Biomedics Inc among others.
Buy Now

Acquisitions/Product Launches

  • In January 2019, Glaxosmithkline Plc acquired Tesaro.
  • In January 2020, Novartis Ag acquired The Medicines Company.

For more Lifesciences and Healthcare related reports, please click here

Synthetic Fabric Market By Type (Acetate Fabric, Acrylic Fabric, Chiffon Fabric, Denim Fabric, Georgette Fabric, Nylon Fabric, Polyester Fabric, Rayon Fabric, Spandex Fabric, Viscose Fabric, And Others) And Application (Construction, Automotive, Healthcare, Apparel, Household, And Others) -Global Forecast 2020 To 2025

Overview

Synthetic Fabric Market size is forecast to reach $72,892.07 million by 2025, after growing at a CAGR of 3.2% during 2020-2025. The Synthetic Fabric is driven by high demand from fashion and apparel industry. The construction and automotive industries will further support the growth of synthetic fabric market during forecast period.  

Cuprammonium rayon is one of the synthetic fabrics that most closely resembles silk, so it’s often used to replace garments traditionally made with this natural fiber. Cuprammonium rayon cannot be washed in hot water, and unlike natural fibers like wool, cuprammonium doesn’t burn cleanly. Lycra fabric is a brand name for elastane, which is a highly elastic synthetic fabric. Despite having different names, Lycra, spandex, and elastane are all the same material, and these fabrics can stretch to 5-8 times their usual size. Polybenzimidazole fiber is a synthetic fiber with a very high decomposition temperature and doesn’t exhibit a melting point. It has exceptional thermal and chemical stability and does not readily ignite.

Report Coverage

The report: “Synthetic Fabric Market – Forecast (2020-2025)”, by IndustryARC, covers an in-depth analysis of the following segments of the Synthetic Fabric Industry.

Key Takeaways

  • APAC dominates the Synthetic Fabric market owing to strong presence of textile, home furnishing, and automotive industry.
  • R&D activities on conductive textiles and nanotechnology in textiles are expected to provide potential growth opportunities.
  • The rising consumer interest in home furnishing boosts market segment growth.

Type – Segment Analysis

Polyester Fabric held the largest share in the Synthetic Fabric market in 2019. Polyester is a manmade fiber known for its superior properties which makes it suitable for Synthetic Fabric applications. The world polyester production for 2016 was 76.66 million tons, including the recycling part. Filaments accounted for 44 percent of total production and dominates the global market followed by staple, comprising 20.2 percent of global sales market share. The other segments include PET Resin shared (27.5%), Film had a market share of (5.3%) and other resins with (2.9%) according to Plastics Insight. The polyester fiber market has grown to such an extent that it represents half of the overall global fabric market. Most of the demand for polyester is from APAC region where the fast growing automotive and textile industry has been consuming high amount of polyester.  

End Use – Segment Analysis

Apparel Industry accounts for the highest market share in the global Synthetic Fabric market and is expected to grow at a CAGR of 5% over the forecast period from 2020 to 2025. The apparel industry is an ever-growing market with key competitors being the countries China, European Union, the United States and India. The clothing sector is growing at an unprecedented rate because of changes in the world of garments. According to Trade Map, Asia registered 35% of apparel export to Europe, followed by 30% within Asian countries, 27% in North and South America, 8% to rest of the world in terms of value in 2016. The growth in apparel sector will fuel the market for synthetic fabrics globally.

The other sector strengthening the Synthetic Fabric market is building and construction. The upsurge in infrastructural activities, will fuel demand for home furnishings.

Geography – Segment Analysis

APAC dominated the Synthetic Fabric market with a share of more than 45%, followed by North America and Europe. Globally, China and India are expected to be the key supplier as well as consumers of synthetic fabrics. India is one of the leading man-made fabric manufacturers in the world. Indian fabrics are known for their outstanding quality, colors and durability. Indian fabrics are set to take center stage in the global arena because of heavy investment, continuous development, new product mix and strategic business expansion. India’s MMF based textile manufacturing is largely focused towards low-value added and commodity products. Nevertheless, demand for synthetic fabrics with added value is growing rapidly around the world. Countries such as China, Taiwan and Korea are already manufacturing textiles based on high-end MMF.

Drivers – Synthetic Fabric Market

·         The cost competitiveness and shift on low cost fibers for clothing manufacturing.

Polyester has proven to be one of the most cost-effective and adaptable fiber and has increasingly picked up the bulk of new business growth. It is recyclable and can be blended with other fibers like cotton and spandex for performance requirements. The demand for polyester fabric continues to increase as the current athleisure fashion trend has resulted in very strong opportunities for growth.

Challenges – Synthetic Fabric Market

·         The U.S. and China’s ongoing trade war will affect the textile and apparel industries, including manufacturing and other activities.

The ongoing trade war between U.S. and China will impact the textile market. According to the World Integrated Trade Solution, the U.S. is the top trading partner of China in terms of Textiles and Clothing, with a product export share of 9.88% in 2017. The trade war may hamper business between the U.S. and China. There is also speculation that the effect can be seen on the trading partners of U.S. and China. If there is decline in trade of textiles, then it will have a direct impact on textile chemicals owing to low demand from the textile industry.  

Market Landscape

Technology launches, acquisitions and R&D activities are key strategies adopted by players in the Synthetic Fabric market. In 2019, the market of Synthetic Fabric has been consolidated by the top five players accounting for xx% of the share. Major players in the Synthetic Fabric Market are BASF S.E, Bayer AG, BP Amono Plc, Far Eastern Group, Fila Inc., Univex SA, and among others.

Buy Now

Acquisitions/Technology Launches

  • In November 2018, PrimaLoft introduced “PrimaLoft Bio Performance Fabric” which is 100 percent recycled biodegradable synthetic fabric. The basis of innovation is to improve fibre technology, which allows a highly accelerated biodegradation under certain environmental conditions. The product is expected to be commercially available from fall of 2020.

Steel Grating Market By Type (Stainless Steel Grating, Carbon Steel Grating, And Mild Steel Grating) And Application (Architecture, Petrochemical, Sewage Disposal, And Others) – Global Forecast 2020 To 2025

 Overview

Steel Grating Market size is forecast to reach $61.74 billion by 2025, after growing at a CAGR of 7.90% during 2020-2025. The steel grating market is expected to grow during the forecast period as it is reliable, durable and strong with high tensile strength when compared to fiber grating and aluminum. Increase in applications and technological innovations in end-use industries is a major factor for the growth of steel grating market during the forecast period.

Report Coverage

The report: “Steel Grating Market – Forecast (2020-2025)”, by IndustryARC, covers an in-depth analysis of the following segments of the Steel Grating Industry.

Key Takeaways

  • Government infrastructure development projects and several government initiatives to promote green buildings have resulted in rise in the construction of commercial and residential properties worldwide, thereby contributing to the market growth.
  • Asia-Pacific region overtop the steel grating market due to increasing demand majorly from residential construction and non-building construction.

By Type – Segment Analysis

Stainless steel grating segment held the largest share in the steel grating market in 2019. Stainless steel bar grating is a set of bearing bars coupled with perpendicular crossbars at different intervals to form a load-bearing panel ideal for use as a pathway for pedestrian and lightweight rolling traffic, which includes hand trucks, carts, and dollies. With an open-grid construction, this grating type requires minimal maintenance and provides superior light passage, air circulation and drainage. Carbon Steel grating is a heavy-duty product that can be used where open flooring is needed for light, air and heat transmission.

By Application – Segment Analysis

Sewage treatment held the largest share in the steel grating market in 2019 growing at a CAGR of 7.32% during the forecast period. Steel grating is widely used as a walkway and platform instead of concrete platforms to overcome obstacles or cross wastewater places in sewage treatment plants. Steel grating platform in sewage plant shares characteristics with good corrosion resistance, easy installation, easy removal, anti-skid, anti-rust and high bearing force.

Geography – Segment Analysis

Asia-Pacific dominated the steel grating market with a share of more than 41% during the forecast period.  In various countries such as China and India, high investments are being made for industrial growth and infrastructure development. Furthermore, expansion of the construction sector, especially in Asia Pacific is anticipated to drive the steel grating market during the forecast period.

Drivers – Steel Grating Market

·         Advancements in technology like high load capacity

The steel grating technology demands contains many aspects, the steel grating loads, material and the steel grating surface treatment. The solid and firm structure makes steel grating have high load-carrying capacity. Especially the swage locked grating and press-locked grating, which can supply the excellent lateral stiffness to the steel grating. The heavy-duty steel grating can not only available for pedestrians walking, but also permit the heavy-duty vehicles safely passing through.

Challenges – Steel Grating Market

·         Emission of carbon during the production of steel grating

The greenhouse gas of most relevance to the world steel industry is carbon dioxide (CO2). According to World Steel Organization, on average for 2017, 1.83 tons of CO2 were emitted for every ton of steel produced. The steel industry generates between 7% and 9% of direct emissions from the global use of fossil fuel. Hence, emission of carbon during the production of steel grating hinders the steel grating market during the forecast period.

Market Landscape

Technology launches, acquisitions and R&D activities are key strategies adopted by players in the hydrofluoric acid market. In 2019, the market of steel grating has been consolidated by the top five players accounting for xx% of the share. Major players in the steel grating market are Amico Industrial Group, Harsco Corporation, Interstate Grating Inc, Lionweld Kennedy, Ningbo Jiulong Machinery Manufacturing Co Ltd, Nucor Corporation, Ohio Grating, and Sinosteel Corporation among others.

Acquisition

  • In February 2017, Fisher & Ludlow, Inc. acquired  the assets of Alabama Metal Industries Corporation’s (AMICO’s) bar grating facility as well as the bar grating equipment and related inventory at three other AMICO locations. Fisher & Ludlow fabricates steel and aluminum bar grating products that are sold under the brand name Nucor Grating.

Smart Water Bottle Market – Industry Analysis, Market Size, Share, Trends, Application Analysis, Growth And Forecast 2021-2026

Smart Water Bottle Overview

Smart Water Bottle Market size is forecast to reach $30.6 million by 2026, after growing at a CAGR of 17.3% during 2021-2026. The growing health consciousness among youth and adults and the rising acknowledgement about hydration tech is enhancing the smart bottle market. Also, the increasing demand for fitness trackers, gym accessory and so on has enticed the development of smart water bottle with wireless technology that is boosting the smart water bottle industry. Furthermore, the growing awareness for ample water consumption among people of different age groups is anticipated to propel the smart water bottle market growth during the forecast period.

Report Coverage

The report: “Smart Water Bottle Industry Outlook – Forecast (2021-2026)”, by IndustryARC, covers an in-depth analysis of the following segments of the Smart Water Bottle Market.By Platform: In Built Hardware, Hydration Tracking Applications.By Type: Metal, Polymer and Others.By Distribution Channel: Online, Offline.By Geography: North America (U.S, Canada, Mexico), Europe (Germany, France, UK, Italy, Spain, Netherlands, Russia and Others), APAC (China, Japan, South Korea, India, Australia, Indonesia, Malaysia and Others), South America (Brazil, Argentina, Chile, Colombia and Others) and RoW (Middle East, Africa).

Key Takeaways

  • North America dominates the smart water bottle market owing to increasing rise in adoption of smart wearable technology and rising awareness for healthier water consumption habits among youth and adults
  • The introduction of artificial intelligence and the Internet of Things (IoT) is also playing a key role in the development of mobile applications that offers information to smart water bottle users regarding their hydration level and intervals of water intake.
  • Growing number of fitness enthusiasts along with the use of emerging technology for  connecting smart wearable devices, and smartphones to the gym accessories in order to track their performance and fitness activity will become the major factor that will fuel the growth of the smart water bottle market
  • The major drawback is the battery life of the smart water bottle that hinders the growth of the smart water bottle market.   

Smart Water Bottle Market Segment Analysis – By Type of Component

Hydration tracking apps segment holds the largest share in the smart water bottle market in 2020 at 62.3%. Majority of the interactive bottle manufacturers are providing their users with accurate information about their daily water intake and allowing them to set personalized hydration goals. As hydration technology has become the central for the youth and adults, the apps are becoming personal systems to help users achieve daily targets.Furthermore, the in-built hardware technology is also playing a key role in enhancing the use of smart water bottle. This technology mainly comprises of smart caps or smart lids containing sensors, liquid thermometer, LEDs, sensor bands and so on that enables the smart water bottle to record the amount of water consumed by the user and also indicates the quantity of water remaining in the bottle. However, the increasing need for healthy lifestyle and rising awareness towards the consumption of more water will lead to the increasing adoption of smart water bottles.

Smart Water Bottle Market Segment Analysis – By Distribution Channel

The majority of the sales occurs through online distribution channel, as smart water bottles currently don’t have high availability in retail stores and other offline stores. Furthermore, the online distribution channel is forecasted to grow at a CAGR of 8.9% through 2026. The online distribution channel is commonly being preferred by customers. Thus, the increasing sales by e-commerce platforms and the easy payments provided by online sales channel will boost the market for smart water bottle as fitness trackers and gym accessories. Another interesting development is the partnership of smart water bottle manufacturers with electronics stores rather than consumer stores. These products are being advertised and sold alongside smart devices rather than water bottles showcasing the marketing is focused more on the smart technology.

Smart Water Bottle Market Segment Analysis – By Geography

North America dominated the smart water bottle market with a share of more than 35%, followed by APAC and Europe. The growing need for advanced fitness tracking systems and the increasing purchasing power of customers are propelling the growth of the smart water bottle market in this region. Moreover, the increasing consumer interest towards health clubs and the usage of technology embedded gym accessories and fitness trackers are also leading to the major factors that is fueling the market growth in North America. According to IHRSA, in 2018, the health club market size of the U.S. alone was valued at $32.3 billion. Increasing obesity rates among the population and changing lifestyle of the consumers are also triggering the smart water bottle market share in this region. Additionally, the rising usage of smart wearable technology is another key factor for the growth of smart water bottle market in North America.
Smart Water Bottle Market, By Component, 2020 (%)

Smart Water Bottle Market Drivers

Increasing Health Awareness

The rapid changing lifestyle of the consumers is leading to the increasing awareness towards health. The increasing consciousness towards health by both youth and the adult is leading to the rising need for smart water bottle market. The use of smart bottle as a gym accessory is also regarded as the major driver that is influencing the requirement of smart bottle in gym and sports club. Additionally, according to International Health, Racquet, and Sports club Association (IHRSA), the global health industry generated a revenue of $94 billion in 2018. As, the consumers are continuing to place high value on health and are widely investing in clubs and services for maintaining fitness will further boost the smart water bottle market

Introduction of Emerging Technology

The increasing number of fitness enthusiasts is leading to the increased adoption of emerging technology such as the use of wearable device, fitness trackers, smart bands, hydrating tracking applications and so on. The introduction AI along with internet of things is also playing a key role in providing mobile apps that provides information to the smart water bottle users regarding their hydration level. The smart water bottle can connect to any mobile device through Bluetooth or internet and is easily accessible from any location. Furthermore, the use of sensor technology is also highly gaining traction and will further drive the smart water bottle market.  

Smart Water Bottle Market Challenges 

High cost & Battery Life

The high cost of smart water bottle is the major challenge that is affecting the growth of the market. As, smart water bottle are in-built with sensor technology and also includes major technical functions such as information about the hydration level to the user and are connected with mobile apps which leads to the increase in cost. Moreover, the average battery life of smart water bottle is 6 months and significantly gets shortened due to alerts or time taken while connecting it to any mobile app that further leads to inaccuracy. Thus, the shortening of battery life is also regarded as the key factor that dampens the growth of the smart water bottle market. 

Market Landscape

Technology launches, acquisitions and R&D activities are key strategies adopted by players in the smart water bottle market. In 2019, the market of smart water bottle has been consolidated by the top ten players – Adheretech Inc., Thermos L.L.C., Hidrate Inc., Caktus, Inc., Ecomo, Groking Lab Limited, Hydracoach, Inc., Moikit, Open-2, LLC, and Lifefuels, Inc.

Acquisitions/Technology Launches

  • In March 2021 BOttel, an Australian brand has created a smart water bottle featuring a glowing flash light to remind you when to drink. Botell – dubbed as the ‘next generation’ of water bottles – can keep track of how much more water you need to drink throughout the day to stay hydrated.
  • In September 2019, Lifefuels, a beverage technology company announced the launch of smart nutrition bottle. This new smart nutrition bottle includes three part systems such as a sleek, smart water bottle and flavorful and nutritious multi-serve FuelPods. Smart nutrition bottle also includes an app for tracking both hydration and nutrition in the user. Thus, the launch of this new product will gather more traction from the users which will propel the smart water bottle market. 

Buy Now

Related Reports

Smart Packaging Market – Forecast (2021 – 2026)Report Code: FBR 0004
Smart Home Devices Market – Industry Analysis, Market Size, Share, Trends, Application Analysis, Growth And Forecast 2019 – 2024Report Code: ESR 10366
For more Information and Communications Technology Market reports, please click here

Design a site like this with WordPress.com
Get started